Fast movers: Top e-commerce sites this week
Introduction
Grips will report the fastest movers in the e-commerce space alerting you which sites are raking in sales so you can stay competitive. With Grips, e-commerce leaders can measure, in real-time, the success of their competitors’ promotional activities, empowering them to make data-driven decisions about how to respond (or not).
Be sure to follow Grips on LinkedIn to be the first to know when we share something new!

Update: January 31
Is Outberknow’s Sales Strategy as Sustainable as Their Products?
Outerknown.com’s winter sale launch on January 30th drove a substantial surge in sales, with Grips estimating $150,967 in daily revenue—more than triple their preceding daily average. This isn’t new for the brand, which frequently sees significant spikes when offering discounts, such as their Cyber Week promotions and the one-day Blanket Shirt sale in October (see email below).
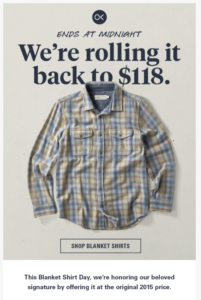
On October 2, 2024, Outerknown held a one day sale discounting their popular Blanket Shirt (normally $168) to $118. Online sales that day reached just over $200,000, up 267% from the average in the days leading up to the sale event.
Consistent Boosts During Promotions
The data tells a compelling story: sales during promotions consistently outperform baseline periods. For example, during the summer sale in July and their Cyber Week discounts, daily revenue typically increased by 2-3x. The most recent Winter Sale spike seen below is no outlier—it’s part of a larger pattern where customers respond (very) strongly to the brand’s discounted pricing.
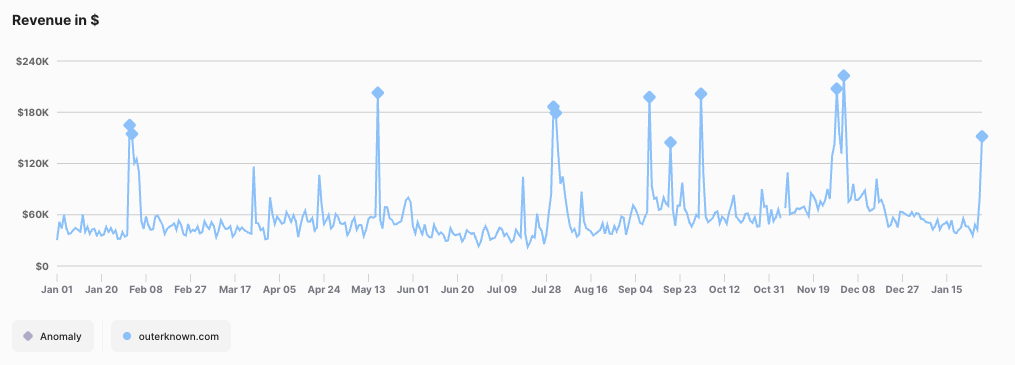
Outerknown.com daily revenue
What This Means for Outerknown’s Overall Performance
Outerknown’s 2024 performance was positive but inconsistent, with year-over-year growth of 3.2%. The key drivers were a strong Q2 and Q4, both up 17% YoY, while the other two quarters saw declines. Their average order value (AOV) for the year was $199, rising to $213 in Q4, reflecting stronger holiday-season spending. Conversion rates also improved in Q4, hitting 2.7% versus 2.6% for the year as a whole.
A Closer Look at Pricing Strategy
Outerknown isn’t just another fashion brand. Their commitment to sustainability and ethical production is a core part of their identity—and that’s reflected in their pricing. The higher price tags are driven by eco-friendly fabrics, fair wages, and responsible supply chains that aim to minimize environmental impact.
The challenge, however, is translating this commitment into consumer value. While some shoppers are willing to pay a premium for ethically made goods, many are not convinced—or possibly fully aware—of what goes into making sustainable products. Outerknown’s reliance on and remarkable success during promotions suggests they may still be working to bridge that gap. If customers only see value during sales, it could mean the brand needs to refine how they communicate the long-term benefits of supporting sustainability.
By emphasizing the story behind each product—how their sourcing helps preserve the environment or uplifts local communities—Outerknown has the opportunity to attract both ethically minded consumers and those who need more persuasion to see sustainability as worth the extra cost.
Balancing Short-Term Gains and Long-Term Growth
Outerknown’s frequent sales suggest that they’re already using promotions to drive immediate revenue, but there’s a bigger picture to consider. Sustaining long-term growth may require more experimentation with pricing models, including potential strategies like lowering baseline prices on key items to attract a wider customer base while maintaining higher margins on exclusive collections.
However, it’s not just about price reductions—it may also be about how effectively they communicate their value proposition. If consumers perceive their sustainable goods as a luxury rather than an essential choice, the brand may need to focus on storytelling, marketing, and education to make the case that eco-conscious fashion is worth the investment. Highlighting the durability of their products, the ethical benefits, and even cost-per-wear comparisons could help justify the premium pricing.
Ultimately, Outerknown’s ability to balance these strategies will determine whether they can convert their current reliance on sales into consistent, long-term growth driven by loyal customers who understand and appreciate the value they’re paying for.
Grips’ ability to monitor daily revenue spikes like this gives brands the competitive advantage of understanding what’s working and how pricing strategies shape performance. Staying ahead of market dynamics—whether through product launches, promotions, or customer behavior—is key to maximizing growth.
Update: January 30
Flower Sales Are Blooming Early—And There’s Still Room to Grow!
Online flower sales are heating up fast, with weekly revenue across 20 major floral sites growing 21% the week ending January 29th compared to the prior week. This surge marks only the beginning of what is expected to be a massive build-up to February 14th, the day when online floral sales typically peak. In fact, last year, daily sales on January 29th were just one-fourth of what they would reach on Valentine’s Day—indicating that the best is yet to come.
Edible Arrangements and 1-800-Flowers Top Overall Sales
While EdibleArrangements.com, which generated $6.8M in the last week, may not sell real flowers, its core competition with floral sites makes its performance worth tracking. Meanwhile, 1800Flowers.com ($4.9M) also delivered strong sales, with both brands leading the highest total revenue in the category.
UrbanStems and SendFlowers.com See Explosive Growth
Among the biggest week-over-week growth leaders were:
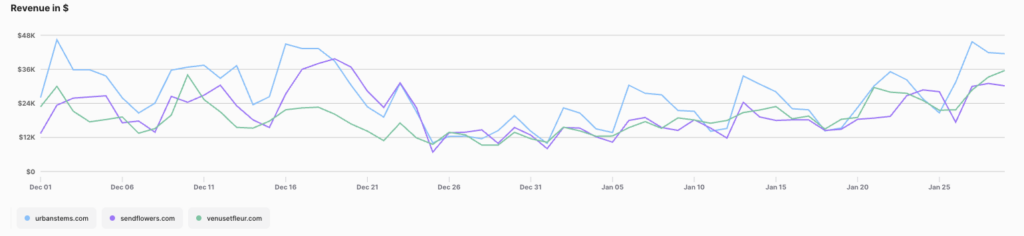
- SendFlowers.com (57% growth)
- UrbanStems.com (48% growth)
- VenusetFleur.com (31% growth)
These brands are doing better than average at capturing dollars by early-bird shoppers, possibly driven by strategic marketing or well-timed promotions. See the chart below showing daily revenue for these sites. Note the surge between leading up to Christmas, the reset and now a steady increase in sales.
Early Risers Owe Success to Wedding Planners
While the broader floral market didn’t start seeing consistent daily revenue growth until January 21st, a few brands jumped ahead of the curve: BloomsByTheBox.com, FiftyFlowers.com, Flowermoxie.com and GlobalRose.com have all experienced sustained growth since at the start of the month, signaling steady demand for bulk and wedding-related orders.
This rise in early growth aligns with broader trends we’re seeing in the wedding space. Bridal wear sites, for instance, have been showing strong increases in sales since the start of the year. [Read more]
A Market in Full Bloom—And a Window Into What’s Next
This surge in flower sales isn’t just a Valentine’s Day story—it’s a glimpse into how seasonal, emotion-driven categories can impact broader market dynamics. With early demand spilling into wedding-related segments, it’s a crucial time for brands to stay tuned to both competitor movements and overarching market trends. Understanding when consumers are spending, where they’re spending and why could be the key to maximizing revenue—not just in flowers, but across categories like bridal wear, gifts, and jewelry.
Update: January 29
Curation Over Discounts: How Dani Michelle’s Edit Boosted Moda Operandi’s Sales
Fashion’s luxury haven, ModaOperandi.com, saw its second-highest single-day revenue in over a year on January 28th, hitting $482,000—36% higher than the average of the previous four Tuesdays. The impressive spike wasn’t driven by any new promotions or discounts but instead leaned on a carefully curated marketing strategy, fueled by a celebrity partnership that resonated with shoppers.
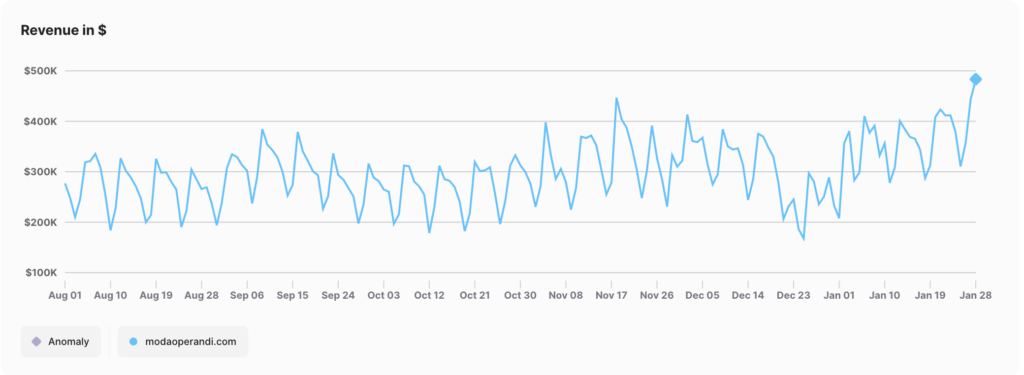
ModaOperandi.com daily revenue
A Strategic Boost Without New Incentives
While the site has been running its “Designer Sale,” with discounts reaching up to 70% as of January 10th, there were no new promotions announced on January 28th that would explain this sudden revenue jump. Instead, the credit likely goes to Moda Operandi’s partnership with Dani Michelle, the celebrity stylist who curated an exclusive edit showcasing her picks of the season. The email announcement was sent out on January 28th, accompanied by an Instagram post that garnered over 4,000 likes—a staggering leap compared to the sub-400 likes typical of their previous posts.

Image featured atop an email sent by Moda Operandi to customers on January 28th announcing the partnership with Dani Michelle
January Sales Momentum After a Tough Q4
Moda Operandi’s success on January 28th capped a month of steady revenue growth following a difficult Q4, during which the site experienced a 23% year-over-year decline and generated $27 million in revenue. The average order value during that period stood at $797, with a 1.37% conversion rate.
But January painted a more optimistic picture. Throughout the month, the retailer saw gradually improving daily sales, culminating in the $482K spike, a nearly $190,000 increase over Q4’s daily average of $293K.
Key Drivers of the January 28th Surge
- The Power of Dani Michelle’s Influence:
As the stylist behind some of today’s most iconic celebrity looks, Dani Michelle brings a level of credibility and allure that luxury shoppers respond to. Her curated edit spotlighted brands like Khaite and Prada, giving high-spending customers access to exclusive looks they trust. - Strategic Timing Amid Sale Season:
Although the Designer Sale had been ongoing since December, Moda Operandi strategically kept the momentum alive by combining the sale with fresh marketing pushes like the Dani Michelle edit. This shows how aligning existing promotions with curated content can enhance consumer engagement and boost revenue without additional discounts.
January 28th Revenue vs. Key Daily Benchmarks
- Revenue on January 28th: $482,000
- Q4 Daily Average: $293,000
- Previous Four-Tuesday Average: $354,000
Even with ongoing promotions, the $482K figure reflects the impact of well-timed influencer marketing and luxury curation, rather than an overreliance on discounts.
What’s Next for Moda Operandi?
If January’s upward trend is any indication, Moda Operandi’s ability to balance exclusivity with strategic partnerships could define its recovery throughout 2025. While deep discounts may continue playing a role, the Dani Michelle success suggests that consumer demand for curated luxury will remain key. Expect the retailer to lean further into collaborations that bring both prestige and profitability.
By avoiding the typical race-to-the-bottom discounting strategy, Moda Operandi is proving that even during sales season, influence-driven marketing can be the ultimate differentiator in luxury e-commerce.
Update: January 28
Soma.com Sees Major Revenue Spike: What’s Behind the Surge?
Soma.com experienced an unexpected revenue surge on Monday, January 27, as single day online sales jumped to $1.03 million—far exceeding Grips Intelligence’s expectations of $728K for the day. This marked a significant spike in performance, considering that daily revenue earlier in January hovered between $360K and $600K. The sudden jump in sales raises the question: What drove this surge?
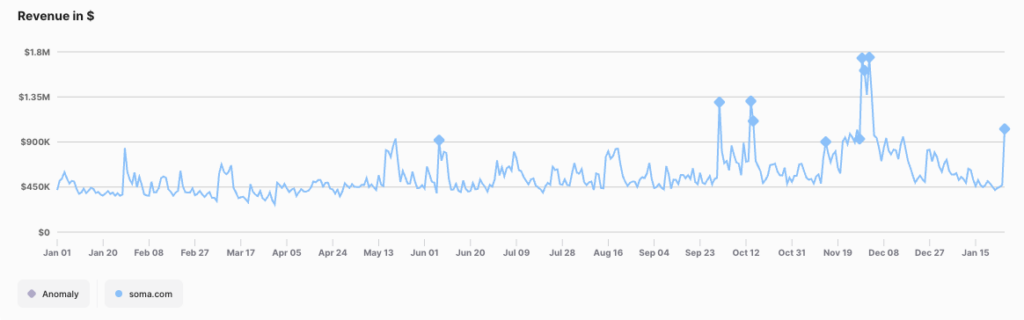
Soma.com daily revenue
A Look at the Current Promotions
While Soma has been running multiple sales since January 24, with promotions continuing through February 11, the revenue spike occurred specifically on January 27. The current sales include:
- Buy One, Get One (BOGO) offers across multiple product categories
- 3 Bras for $99—a deal that has historically performed well
Notably, the last time Soma.com experienced a similar spike outside of Cyber Week was on October 14th, when the company ran another aggressive sales event. The current January promotion follows a similar pattern, suggesting that these types of sales resonate strongly with Soma’s customer base.
Timing and Marketing Strategy
Interestingly, both the January 27 and October 14 revenue spikes occurred on Mondays, despite sales launching before those dates. This pattern suggests that while Soma.com introduces its promotions earlier, customers may delay their purchases until the start of the workweek. The Monday spikes could be attributed to shoppers planning purchases over the weekend and completing transactions once the workweek begins. Additionally, email marketing or digital ad campaigns ramping up on Mondays may be reinforcing these trends.
The timing of Soma’s latest sale aligns perfectly with Valentine’s Day shopping trends. Read more about the growth in lingerie sales in the lead-up to Valentine’s Day here. The retailer’s homepage prominently features red and pink colors, emphasizing an appeal to seasonal shoppers looking for intimate apparel. These visual cues, combined with strong promotional pricing, likely contributed to the spike in conversions.
Year-over-Year Growth
Soma.com’s Q4 2024 revenue grew by an impressive 91% year-over-year, driven by increases in sessions, conversion rates and average order value. These combined factors have helped the retailer attract more shoppers and encourage higher spending per purchase and more repeat purchase behavior as well.
These improvements indicate that Soma.com has successfully optimized its online sales funnel, attracting more shoppers and encouraging higher spending per purchase.
What This Means for the Industry
Soma’s revenue surge highlights the impact of well-timed promotions and strategic digital marketing. The success of the January sale suggests that intimate apparel brands can see significant revenue lifts when leveraging:
- Compelling promotions that offer clear value (e.g., BOGO, bundle deals)
- Seasonal marketing that taps into key shopping trends
- Optimized digital experiences to maximize conversion rates
Final Thoughts
While it remains to be seen whether Soma will keep the momentum going into February, the data suggests that its promotional strategy is off to a good start. If the brand continues leveraging strategic sales events, it could further solidify its growth trajectory in 2025.
For brands looking to compete in the intimate apparel space, tracking Soma.com’s strategy—and using real-time competitor insights like those from Grips Intelligence—can provide a crucial advantage in understanding and reacting to market trends.

Update: January 20
Nintendo’s New Console Sparks a Multi-Day Revenue Surge
Nintendo fans have been waiting years for a meaningful hardware update—really waiting. The original Nintendo Switch debuted back in 2017, and while it received minor feature tweaks and a “Lite” version along the way, January 16, 2025 brought the first full-fledged successor: the Nintendo Switch 2. The excitement surrounding this launch was felt immediately on Nintendo.com, where revenue soared from around $4.07M on January 15 to a staggering $17.07M on launch day. Over the following two days, sales remained robust at $10.96M and $8.80M, respectively.
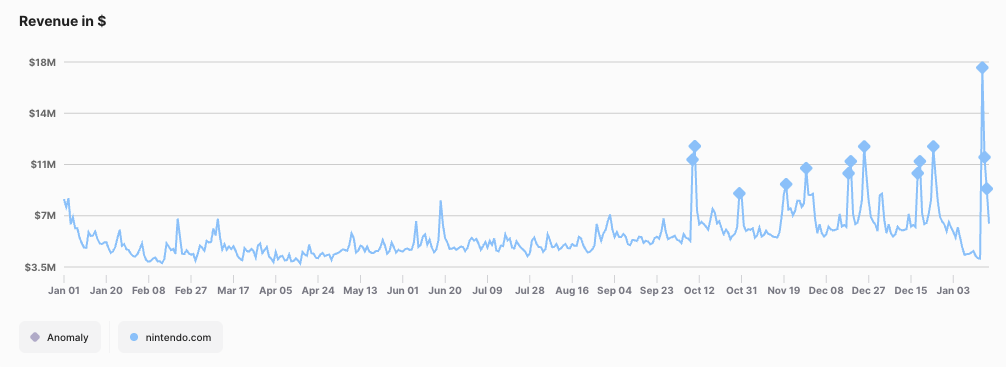
Nintendo.com daily revenue
What’s Driving the Hype?
- Long-Standing Demand
- Since the original Switch was released nearly eight years prior, many fans were clamoring for an upgrade. Limited console options in the Nintendo ecosystem only amplified this pent-up demand.
- Significant Hardware Leap
- Rumored improvements to graphics, processing power, and battery life turned heads. The promise of bigger, more ambitious titles on the new hardware further fueled early adoption.
- Scarcity & Freshness
- With few new consoles hitting the market in recent years, the Switch 2 stands out—even among competitors. Gamers worldwide flocked to secure day-one units before stock ran short.
Record-Setting Launch Sales
- January 16: Revenue $17.07M (4x higher than the day before)
- January 17: $10.96M
- January 18: $8.80M
These numbers mark one of the biggest multi-day spikes in Nintendo’s recent history. Prior to the launch, daily sales typically lingered in the $4–6M range—proof that a major console release can immediately galvanize the gaming community.
Momentum and Market Impact
This surge arrives on the heels of a strong Q4, during which Nintendo.com’s overall revenue climbed by 7.4% year over year. Transactions also rose by 7.5%, underscoring steady user engagement. With the Switch 2 finally on shelves, 2025 is shaping up to be another banner year for Nintendo’s hardware sales—potentially surpassing the massive success the original Switch enjoyed at its peak.
Bottom Line: When Nintendo drops a new console, it still commands the full attention of gamers—and their wallets. The Switch 2’s debut demonstrates that even after years of minimal hardware changes, anticipation for the next big system remains alive and well in the gaming community. Expect demand to stay high in the coming months, particularly if early third-party titles prove to harness the new hardware’s potential.
Update: January 17
Love is in the air—and it’s powering a surge in sales for bridal retailers!
From metallic velvet gowns at BalticBorn to chic wedding-party looks at Sachin & Babi and Kennedy Blue, many of the top bridal sites have enjoyed an impressive revenue surge since the New Year. And it’s no coincidence: proposals often hit a high note over the holidays, meaning newly engaged couples are now flocking online for that perfect dress—whether for themselves, their bridesmaids, or the mother of the bride.
As daily aggregated revenue across 13 sites with specialties in bridal-wear rocketed from around $1.8M at the end of December to $3.5M+ by mid-January, it’s clear that the post-holiday engagement season remains a competitive season for the bridal industry. Below, we take a closer look at which styles are turning heads this winter and how key sites are positioning themselves to capture the hearts (and budgets) of soon-to-be brides everywhere.
Engagement Season in Full Effect
It’s no secret that many couples get engaged over the holidays, and from the looks of these numbers, newly minted brides aren’t wasting time. The aggregated data shows revenue nearly doubling from December’s daily averages by mid-January—evidence that as soon as the ring is on, the dress hunt begins.
Key Metrics & Milestones
- December 31, 2023: Aggregate revenue stood at $1.79M
- January 2, 2024: Revenues jumped past $2.6M, a 45% increase from just a couple of days earlier
- January 14, 2024: Sales crossed $3.33M
- January 15, 2024: Hit $3.62M, one of the top daily totals so far this year
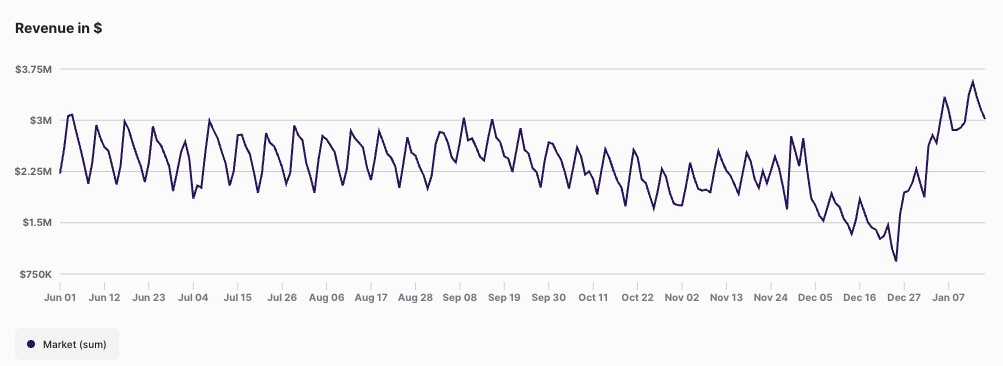
Bridal dress specialty retailer aggregated daily revenue
Standout Retailers
While all 13 sites show an upward trend, a few are consistently pulling in the biggest chunks of revenue:
- Azazie.com
- Known for customizable, affordable bridal and bridesmaid dresses, Azazie’s daily online revenue numbers routinely top $700K–$900K in January.
- Davidsbridal.com
- A mainstay in wedding apparel, David’s Bridal continues to hold strong, often exceeding $300K in daily online sales since the start of the year.
- Birdygrey.com
- Popular for bridesmaid dresses, Birdy Grey’s daily online revenue soared past $200K multiple times in the January–February stretch.
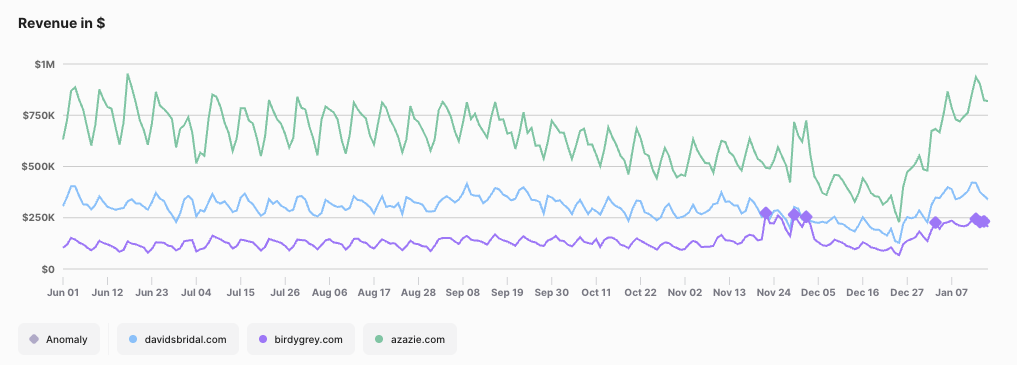
Azazie.com Davidsbridal.com BirdyGrey.com daily revenue
Top Sellers Lighting Up the Bridal Scene (including bridesmaid and mother of the bride)
BalticBorn:
- Carmine Maxi Dress | Wine Floral – $129
- Carmine Maxi Dress | Green Floral – $129
- Kendra Embroidered Dress | Black – $89
- Jolie Embroidered Tulle Dress | Sage + Gold Floral – $85
- Corinne Shimmer Maxi Gown | Champagne SOLD OUT – $99
Sachin & Babi:
- Sophia Gown | Midnight – $1,400
- Estelle Gown | Poseidon – $2,200
- Pryce Gown | Glacial Blue – $1,250
- Marta Gown | Noir Bouquet – $1,350
- Bonnie Gown | Pewter – $1,400
Kennedy Blue:
Whether it’s sumptuous velvet, shimmery sequins, or embroidered floral accents, these standout designs show brides and bridal parties are leaning toward bold textures and eye-catching silhouettes—perfect for winter and spring weddings.
Why the Spike?
- Holiday Engagements
- The weeks between Thanksgiving and New Year’s are notorious for proposals. Once engaged, many brides begin researching dresses immediately—especially while holiday or New Year’s promotions are still running.
- Early Planning
- With many weddings set for summer or fall, brides are ordering dresses now to allow time for shipping, alterations, and accessory coordination.
- Omnichannel Influence
- Major bridal retailers leverage social media, email campaigns and referral programs to convert newly engaged couples into customers quickly after the proposal.
Looking Ahead
While the biggest surge often aligns with January’s wave of post-holiday engagements, bridal sales can remain elevated well into spring, as couples finalize their wedding plans and move on from buying bridal gowns to selecting bridesmaid and mother of the bride dresses. Retailers should watch for continued growth around long holiday weekends and major wedding expos—periods when couples often ramp up planning.
Bottom Line
For bridal-focused e-commerce, Q1 is looking brighter than usual, with daily aggregate revenue for these 13 sites consistently outpacing late December levels by wide margins. Whether it’s brides taking advantage of seasonal deals or simply that real wedding timelines are shrinking, 2025 is shaping up to be a banner year for the bridal industry—fueled, in large part, by a surge in holiday proposals.
Key Takeaways
- Record Revenue: Aggregated data shows daily bridal sales nearly doubling from late December to mid-January.
- Trending Textiles: Luxurious velvet (BalticBorn’s Mable Dress) and statement gowns (Sachin & Babi’s Estelle Gown) are top performers.
- Variety of Price Points: From $2.00 swatches to four-digit designer gowns, the bridal space caters to every budget and wedding vision.
If these results are any indication, 2025’s wedding season is already on track to sparkle and shine—just like the dresses that newly engaged brides (and their squads) are snapping up online.
Update: January 16
Mary Ruth Organics Sees Record-Breaking Days During TikTok Super Brand Day
Mary Ruth Organics just had three of its biggest revenue days in over a year—and interestingly, it all happened while TikTok was running its Super Brand Day from January 13–15, 2025. According to our data, January 13 hit $192,974.60, January 14 tallied $181,260, and January 15 reached $171,762—each surpassing any single-day total from the past 12 months.
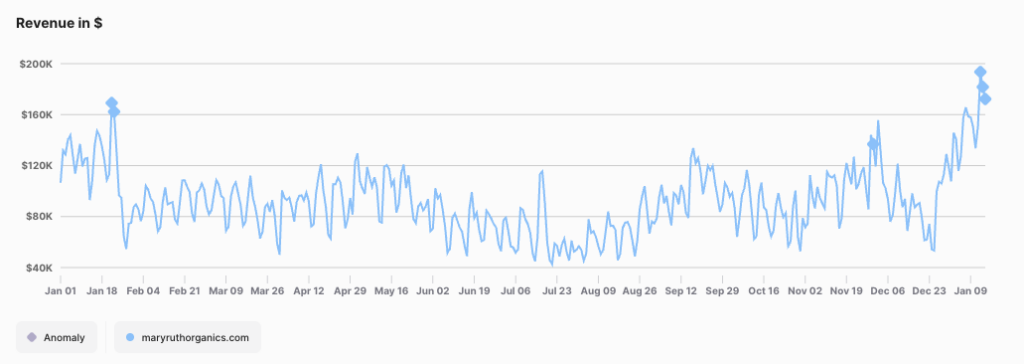
MaryRuthOrganics.com daily revenue
The TikTok Connection
Mary Ruth Organics has a notable presence on TikTok, amassing 355.5K followers and over 1.1M likes. During Super Brand Day, the brand was featured with special offers on the TikTok Shop, but our tracking indicates Mary Ruth Organics also provided similar discounts on its own website. Coupon codes like MROCLAIREC and MA30 popped up, suggesting a coordinated push across channels. Even though Grips does not track direct TikTok Shop transactions, the uptick on MaryRuthOrganics.com alone highlights TikTok’s potential for driving external site traffic and sales.
What Shoppers Bought
While a variety of items received a sales boost, the products below saw above average growth in daily revenue during Super Brand Day promotion—powering the record-setting totals:
- Liquid Morning Multivitamin + Hair Growth
- Already a mainstay product, sales soared by 116% on January 13–14 compared to earlier in the week (Jan 8–11).
- Liquid Iron
- Spiked by 140%, making it a surprise hit among shoppers seeking energy and immune support.
- Liquid Morning Multivitamin
- Jumped by 281%, underscoring the strong appeal of Mary Ruth’s signature liquid formulas.
- Kids Organic Multivitamin Liposomal & various Kids Gummies
- Supplements for kids and toddlers were also big winners, sustaining robust daily sales throughout the promotion.
In previous months, these very same products—particularly the Liquid Morning Multivitamin + Hair Growth—were already top earners, reaffirming their year-round popularity.
Year-Over-Year Growth
Mary Ruth Organics ended 2024 with $33M in total site revenue—up 39% year over year—despite only a 3.7% rise in sessions. The star metric is the conversion rate, which leaped to 5.55% from 4.22% in 2023, a 32% jump that more than offset modest traffic gains. Meanwhile, the AOV (average order value) held steady at around $74.
The Uncertain Road Ahead
Despite this success, Mary Ruth Organics faces a looming question mark over TikTok’s future in the U.S. Should TikTok face restrictions or an outright ban, brands reliant on its platform for reach and revenue—including Mary Ruth Organics—could be exposed to sudden shifts in marketing ROI. For now, Mary Ruth Organics is riding high on TikTok’s viral wave, leveraging consistent brand messaging, discount codes, and a streamlined on-site checkout process to convert curiosity into purchases.
Key Takeaways
- Record Revenue: January 13–15 marked the top three sales days in a year, aligning with TikTok’s Super Brand Day.
- Conversion Climb: A 32% increase in site conversion (to 5.55%) was the prime driver behind a 39% annual revenue jump in 2024.
- TikTok Influence: Although Mary Ruth Organics matched some TikTok Shop discounts on its website, the platform’s overall promotional push drove a surge in direct-site sales as well.
- Future Risks: A potential U.S. ban on TikTok raises uncertainty for brands like Mary Ruth Organics, which have forged deep connections with loyal followers on the app.
By capitalizing on TikTok’s Super Brand Day and backing it up with strategic web-based promotions, Mary Ruth Organics demonstrated how a well-synced omnichannel play can yield standout results—even amid questions about the platform’s longevity in the U.S.
Update: January 15
DJI Takes Flight: New Drone Releases Propel Revenue to Fresh Heights
DJI’s online sales have soared in early 2025, in large part due to the debut of two highly anticipated products:
- DJI O4 Air Unit (launched on January 10, 2025)
- DJI Flip (an all-in-one vlog camera drone, introduced on January 14, 2025)
Launch-Week Spikes in Revenue
Prior to 2025, DJI’s daily revenue typically on DJI.com hovered near $1.4M–$1.5M. But on January 9, buzz around the upcoming O4 Air Unit propelled sales to $2.38M. Following the official release on January 10, the company consistently surpassed the $1.5M mark—setting the stage for an even bigger leap when the DJI Flip was unveiled just days later.
On January 14, the day the DJI Flip went live, DJI’s revenue rocketed to $3.65M—an anomaly-level figure well above its typical run rate. This indicates that consumers, from hobbyists to professional videographers, jumped at the chance to purchase the new vlog-focused drone.
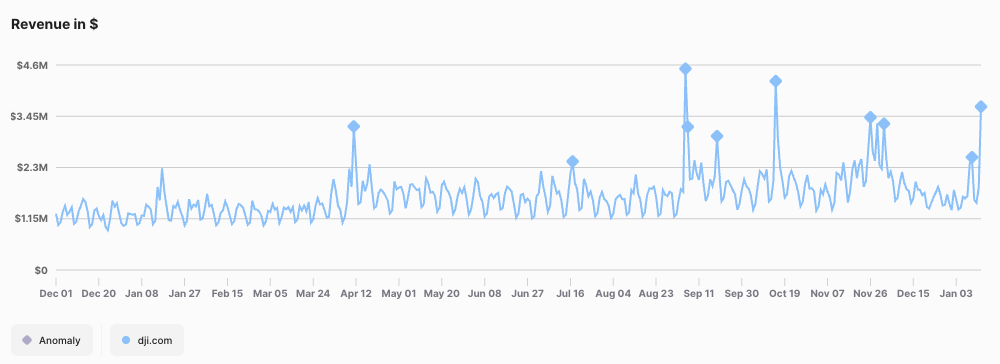
DJI.com daily revenue
What’s Fueling the Surge?
- Targeted Email Campaigns: DJI teased each launch via emails like “DJI O4 Air Unit Is Available!” and “Say Hello to DJI Flip”, creating excitement and urgency.
- Extended Holiday Promotions: Post-holiday deals and bundles likely converted late-season shoppers seeking advanced camera gear.
- Strong Accessory Upsell: DJI’s average order value (AOV) has trended upward, suggesting buyers are adding extra batteries, advanced controllers, and other accessories at checkout.
Looking Ahead
Such large spikes often taper off once the immediate launch buzz subsides. However, ongoing promotions (e.g., bundle discounts, influencer coverage) may sustain elevated revenue for several weeks. If DJI continues pairing fresh product announcements with compelling offers, expect more seven-figure days as drone enthusiasts keep snapping up the latest gear.
Key Takeaway
The back-to-back releases of the DJI O4 Air Unit and the DJI Flip have propelled DJI beyond its usual daily revenue baseline. By timing new product launches alongside well-crafted email campaigns and enticing bundles, DJI is converting excitement around cutting-edge technology into quick, substantial sales gains.
Update: January 14
Peloton Powers into 2025 with Big Wins and Bigger Revenues
Peloton wasted no time fueling 2025 fitness resolutions, repeatedly crossing the $1M mark in daily e-commerce revenue one onepeloton.com and triggering multiple anomaly alerts. Over the four weeks leading up to January 1, the company averaged about $900K in daily sales—already a solid figure by most e-commerce standards. Yet within days of the New Year, Peloton soared well above that baseline.
On January 2, 2025, revenue spiked to $1.34M, roughly 50% higher than the recent average. Just four days later, on January 6, Peloton notched a formidable $1.42M, pushing the brand’s daily performance to nearly 60% above its usual run rate. Another big jump on January 13 hit $1.31M, suggesting Peloton’s strategic promotions continue converting would-be buyers into paying customers.
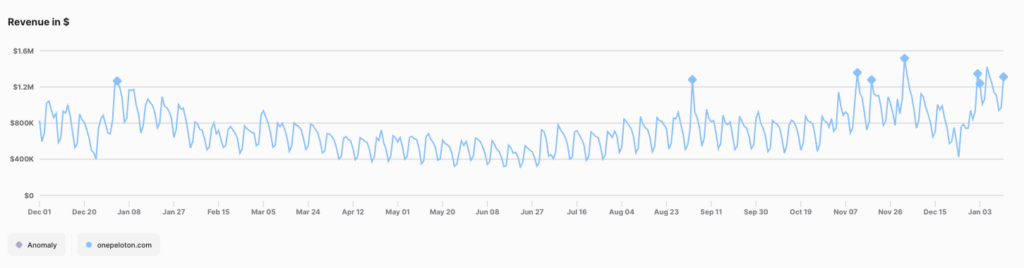
Onepeloton.com daily revenue
What’s Driving the Surge?
A quick visit to Peloton’s homepage reveals targeted calls to action like “Finance Your 2025 Fitness Journey” and “Up to $600 Off Peloton Packages,” mirroring recent email campaigns touting limited-time offers. By lowering the initial cost—through discounts and accessible financing—Peloton makes it easier for shoppers to justify an at-home fitness investment at the start of a new year.
How Long Can They Keep It Up?
If past years are any indication, Peloton’s New Year’s buzz may begin to dip around early-to-mid February as resolution-driven shoppers finalize their purchases. Still, ongoing discounts or added perks (such as extended financing plans) could stretch this hot streak further into winter. For now, multiple $1M+ revenue days demonstrate the brand’s knack for tapping into seasonal demand at just the right moment.
Key Takeaway
With daily revenue pushing as much as 60% above its four-week rolling average, Peloton’s well-timed promotions and strong messaging are clearly resonating. The question remains whether the brand can maintain this momentum beyond the initial resolution rush—but these early numbers hint that Peloton is off to a very fast start in 2025.
Update: January 13
Room & Board Rings in the New Year with Fresh Looks and Higher Revenues
Room & Board seems to be kicking off the new year on a stylish note, as recent promotions and seasonal messaging appear to coincide with pronounced revenue spikes on RoomandBoard.com. In the four weeks before January 1, the furniture retailer averaged around $1.05M–$1.10M in daily revenue. But starting in early January, we’ve observed multiple days soaring well above that baseline, suggesting Room & Board’s home refresh campaigns are resonating with shoppers.
From Holiday Highs to January Surges
- January 2, 2025 – Reached $1.26M
- January 6, 2025 – Climbed to $1.31M
- January 13, 2025 – Hit $1.27M (flagged as an anomaly)
These elevated numbers follow a strong holiday season, where Room & Board saw big revenue days in late November and December—often correlating with sitewide sales and giftable pieces. The momentum appears to be carrying over into 2025 as customers look to refresh their spaces for the new year.
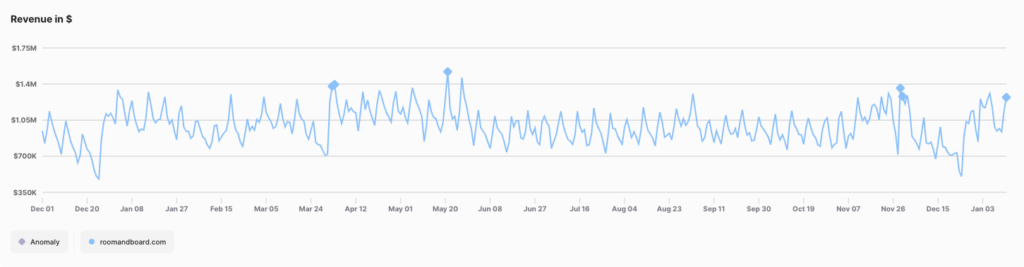
RoomandBoard.com daily revenue
What’s Behind the Boost?
A glimpse at Room & Board’s recent emails offers clues. Campaigns like “A Fresh Start”, “Refresh Your Room”, and “Your Perfect Palette” invite customers to reinvent their homes with new finishes, rugs, and organizational pieces. They’ve also run a “$4K Storage Giveaway,” tapping into the post-holiday urge to declutter and reorganize. Messages like:
- “New! Fresh takes on popular upholstered beds” – Encourages bedroom upgrades
- “How to Choose a Desk” – Targets the growing market of home-office shoppers
- “Last chance to save on new rugs” – Ties a promotional hook to a fast, impactful room update
By showcasing versatile pieces and offering a chance to win a sizeable gift card, Room & Board creates both aspiration and urgency—two powerful motivators that can bump daily revenue past average levels.
Looking Forward
Historically, interest in home furnishings often peaks in the first quarter as consumers embrace new beginnings. Room & Board’s January email lineup points toward a concerted strategy: combining fresh product reveals with promotions that tap into the “start the year off right” mindset. If this approach continues—especially with giveaways and timely reminders of how to update living spaces—we may see more days crossing that $1.2M+ threshold well into the early spring season.
Key Takeaway
With daily revenue consistently outpacing its typical $1.05M–$1.10M run rate, Room & Board’s focus on “newness” and smart storage solutions is paying dividends. Their targeted emails—promoting everything from fresh color palettes to a $4K giveaway—underscore how well-timed marketing can convert winter home-improvement whims into strong sales. As 2025 unfolds, all signs point to Room & Board keeping living spaces (and its own revenue) on an upward trajectory.
See the performance of thousands of sites
Grips reports on the daily, weekly and monthly e-commerce sales for tens of thousands of domains. Book a demo today and we’ll give you a sneak peak into your comp set.

Archives
See fast-movers from: