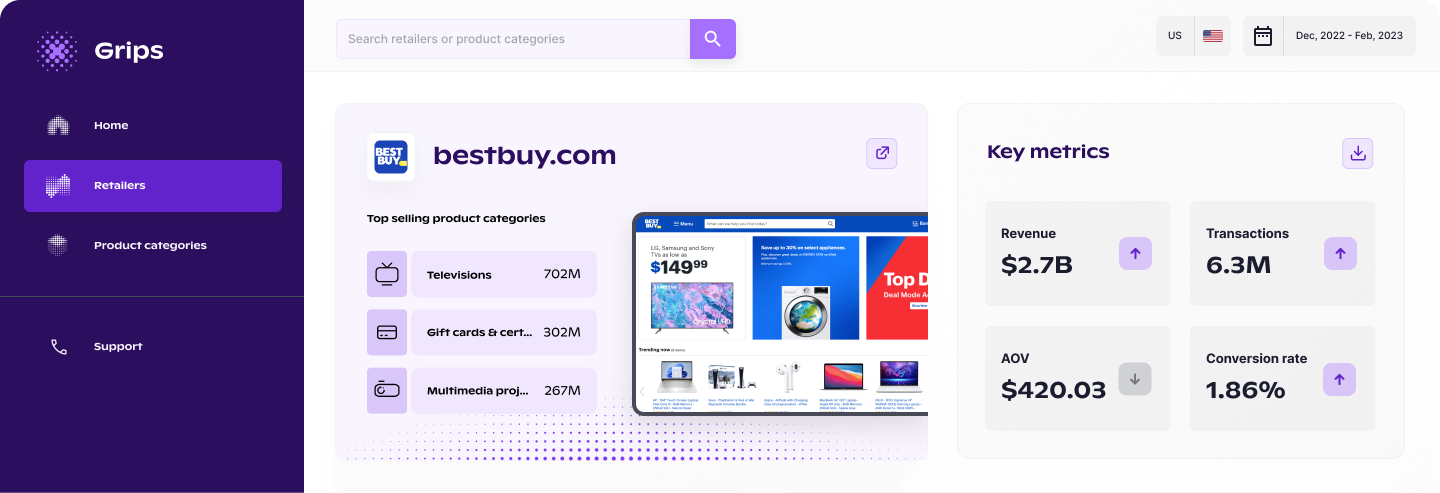
Product-Level Market Intelligence
Daily product-level monitoring of revenue, units sold, key attributes, and more from top retailers, marketplaces, and D2C brands — covering both online and offline channels.
 Power Drills · homedepot.com · online and in-store
Trusted by leading, brands, retailers and researchers








Live market intelligence from real sales data
Grips measures what actually sold, product by product, day by day.
- Every product, not a sample.We track the full catalog at each retailer, so every brand is visible from day one, including the ones panels and surveys never catch.
- Online and in-store, one dataset.The same SKU, followed across a retailer’s website and its physical stores, in one number.
- Daily, at the SKU level.Revenue, units sold, price, and product attributes, updated every day, not once a quarter.
Your biggest market questions, answered
Every product sold, every day
Every product sold, every day, row by row: retailer, channel, product, brand, category, units sold, revenue, and price. This is the feed everything else is built on.
See a live sample for your category →Market share across retailers
The daily performance of every brand in your category, at every retailer: units sold, revenue, and share. Yours, and everyone else’s.
See who’s winning your category →Pricing & promotions
See every price change for any tracked product, next to its daily units and revenue, so you know what a price move actually did to sales.
See what prices are moving in your market →Category & demand trends
See whether a category is growing and where demand is moving, across product types, price tiers, and retailers, with the products behind every shift one click down.
See where your category is heading →
The in-store side of the market
The same SKU-level tracking extends into physical stores. See where a product sells across each retailer’s store network, region by region, next to its online numbers.
See your brand in stores →Features, next to their sales
Line up competing products feature by feature — specs, batteries, connectivity — next to their price, units, and revenue. See which features actually command a premium in your category.
Compare the products in your category →Powering sales for top retailers and brands
The insights you need to make the right decisions — in minutes
Ask any question about a competitor, brand, or category in plain language — straight from Claude, ChatGPT, or any LLM agent. The Grips MCP server turns it into structured, actionable analysis in seconds.
- Powered by real market data, not model outputs. Every answer draws on product-level sales, pricing, and revenue tracked across major retailers, updated daily.
- Drill into the data, not just the summary. Break any answer down by retailer, brand, category, or time period to find what matters.
- No exports, no copy-paste. Competitive intelligence flows directly into your team's AI workflows.
grips.top_products
Three products led drill-category revenue at Home Depot stores on today:
Combo kits led the day — worth a price check against your own 20V lineup.
Works with any MCP-compatible client