data methodology
How we make all
e-commerce sales visible
We understand that data reliability and accuracy are crucial when it comes to making decisions in e-commerce. Read on to learn about our unique dataset and why we're confident it can deliver growth.

65k+
Domains tracked
1B+
Unique SKUs tracked
200B+
Monthly revenue tracked
Trusted by these E-Commerce champions:


So, just how does our data process work?
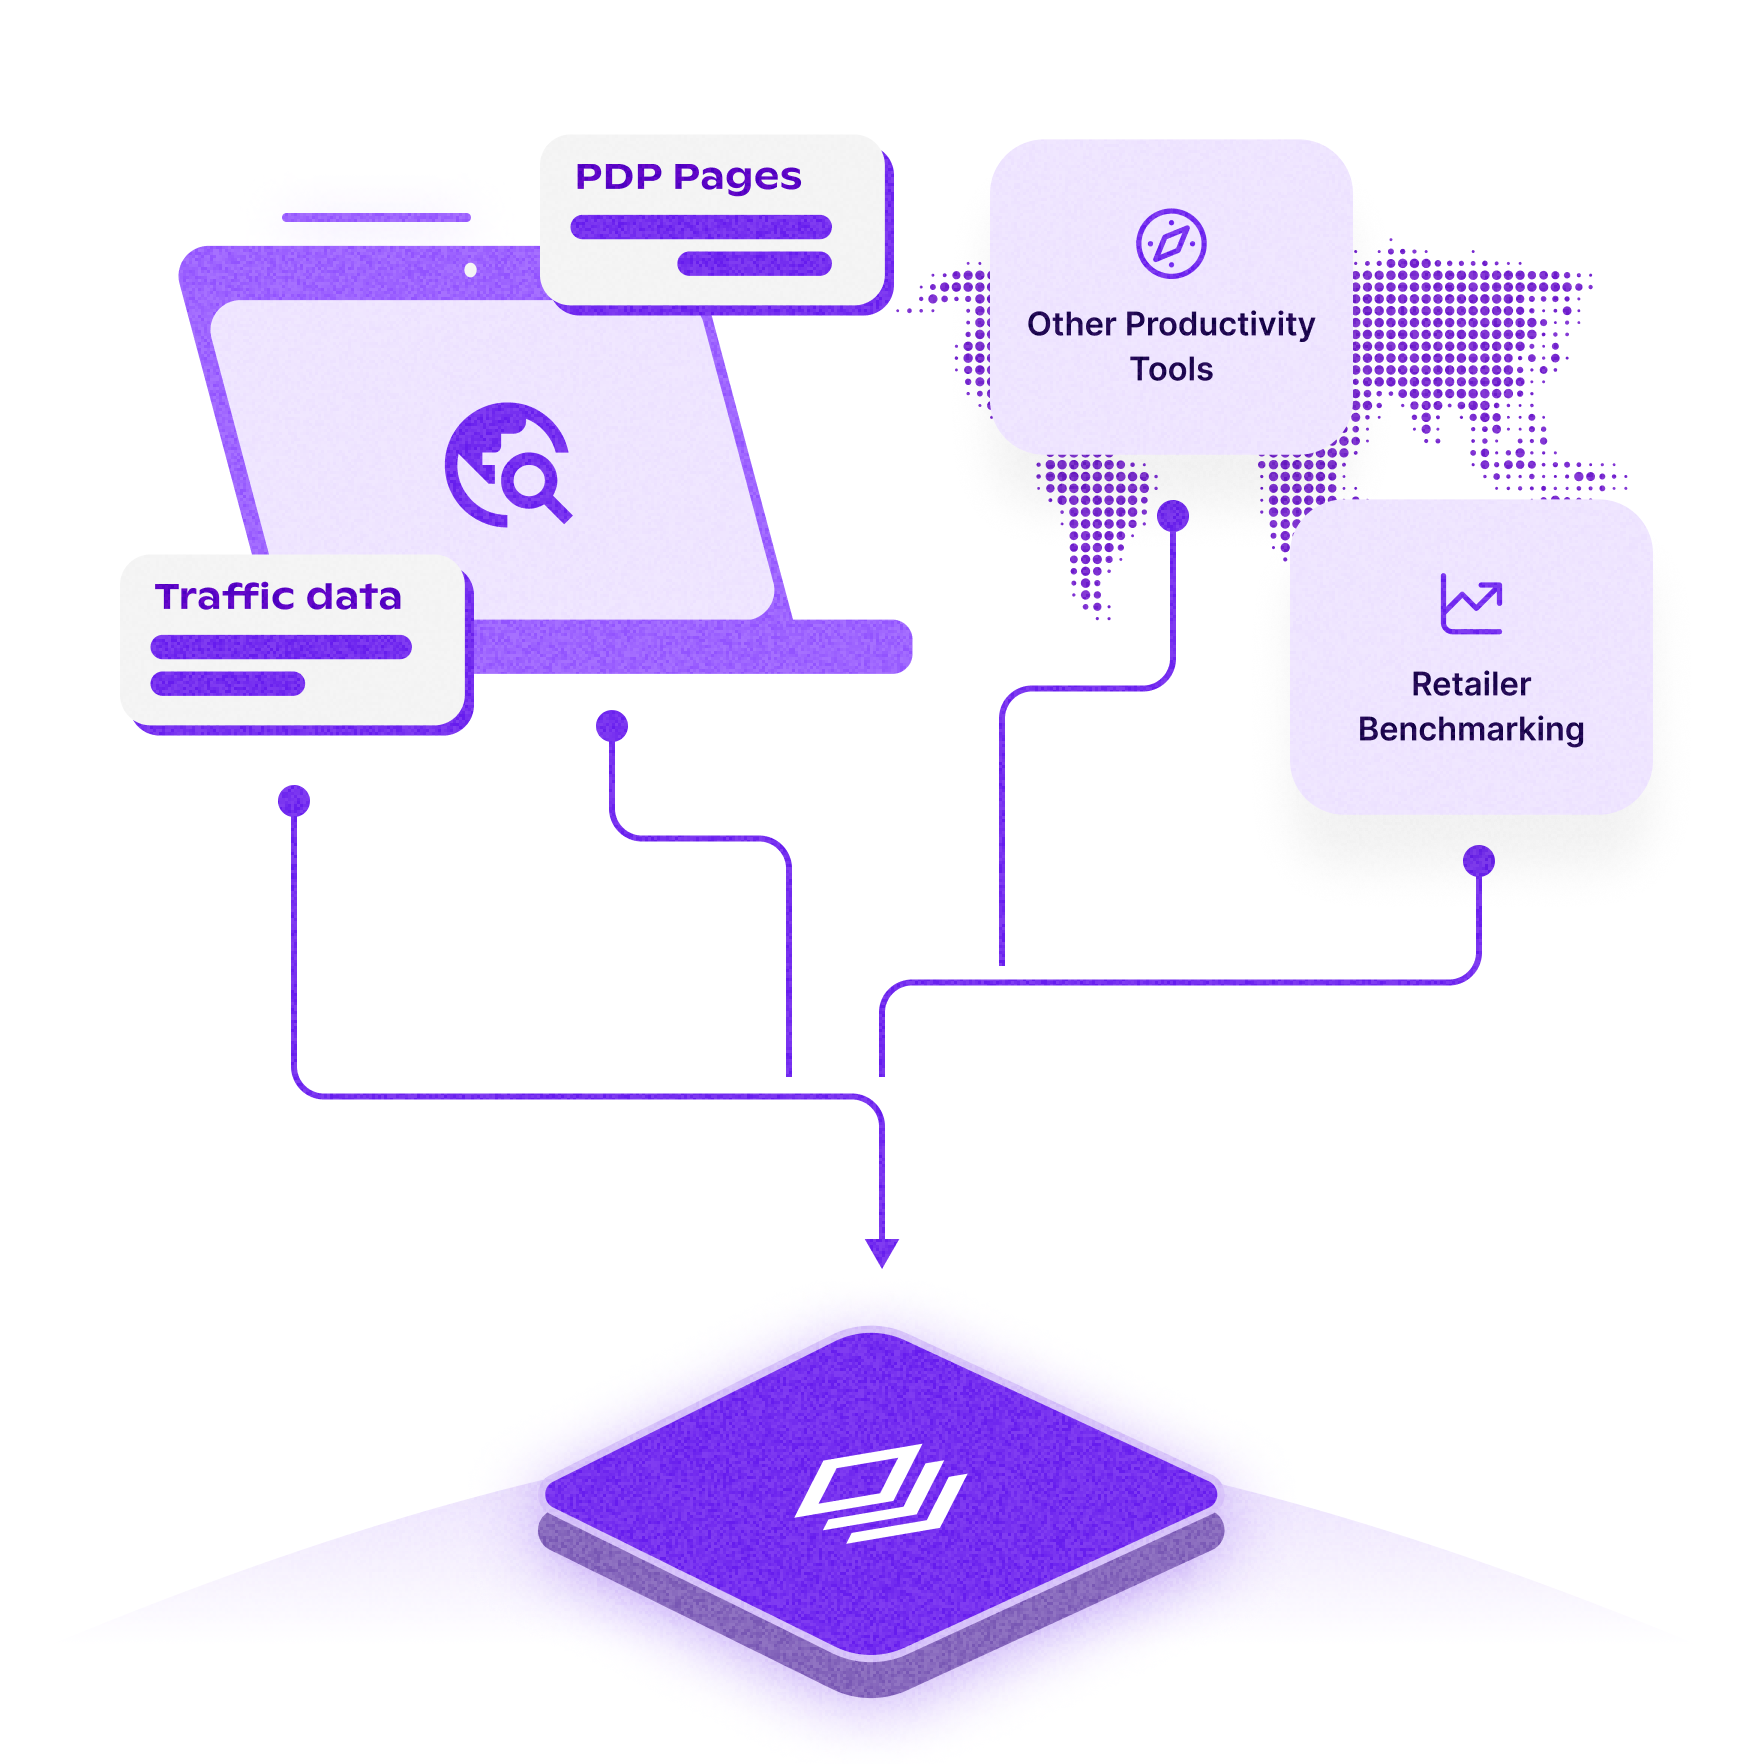
DATA COLLECTION
Gathering data on a global scale
Grips' model relies on unique first-party data from over 200K e-commerce merchants, purchased traffic data, web scraping, receipt scanning, consumer panels, and other sources to generate predictions. This diverse data collection feeds into the models, ensuring comprehensive and accurate insights for both known and unknown merchants.
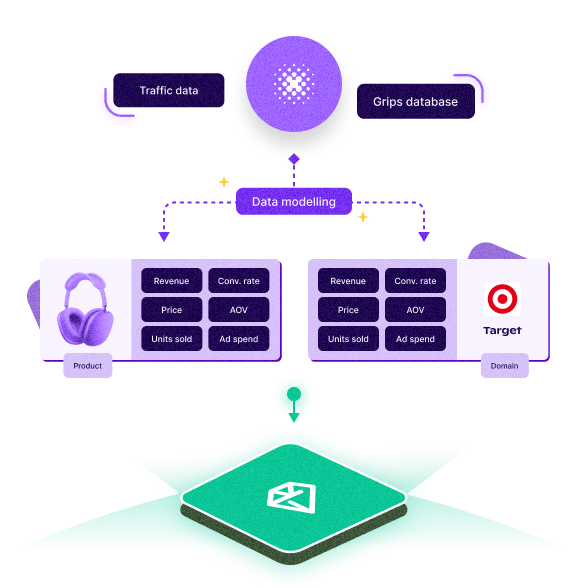
DATA MODELLING
Calibrating prediction for extreme accuracy
The Grips model uses various data points and compares them to our true dataset, adjusting different variables in the algorithm. This process allows it to predict outcomes for both domains and products where Grips has first-party data and those where it doesn't.
Our research partners


Transforming data into growth
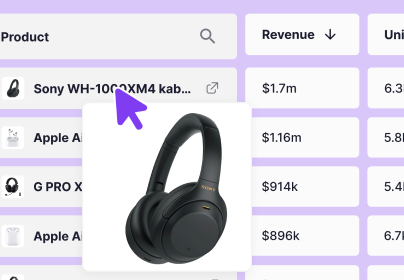
Competitor Intelligence
Compare your revenue, conversion rate, AOV, and other key metrics and benchmark against competitors. Dive into drivers like assortment, marketing channels, ad spend, demographics, and devices and more, to identify revenue growth opportunities.