


Understanding eCommerce Benchmarks: A Complete Overview
What is eCommerce benchmarking and why is it important?
Ecommerce benchmarking is the process of evaluating and comparing the performance of an online business against industry standards, best practices, or competitors. This involves analyzing key performance indicators (KPIs) such as conversion rates, website traffic, customer acquisition costs, and other relevant metrics. The goal is to gain insights into how well the business is performing in comparison to established benchmarks or competitors in the digital commerce landscape.
Importance of Ecommerce Benchmarking:
Performance Evaluation:
Ecommerce benchmarking allows businesses to assess their performance objectively. By comparing key metrics to industry benchmarks, businesses can identify areas of strength and weakness, helping with data-driven decision-making.
Competitive Analysis:
Understanding how a business compares to competitors is crucial for staying competitive in the market. Benchmarking helps businesses identify industry leaders, assess competitor strategies, and set realistic performance goals.
Identifying Opportunities for Improvement:
By benchmarking against industry standards, businesses can pinpoint areas where they fall short or excel. This insight is valuable for identifying opportunities for improvement, optimizing strategies, and enhancing overall efficiency.
Goal Setting:
Benchmarking provides a basis for setting realistic and achievable goals. Businesses can establish performance targets based on industry averages or the performance of top competitors, guiding them in their pursuit of success.
Strategic Decision-Making:
Informed by benchmarking data, businesses can make strategic decisions regarding marketing strategies, user experience improvements, and other aspects of their ecommerce operations. This helps allocate resources effectively to areas that impact the bottom line.
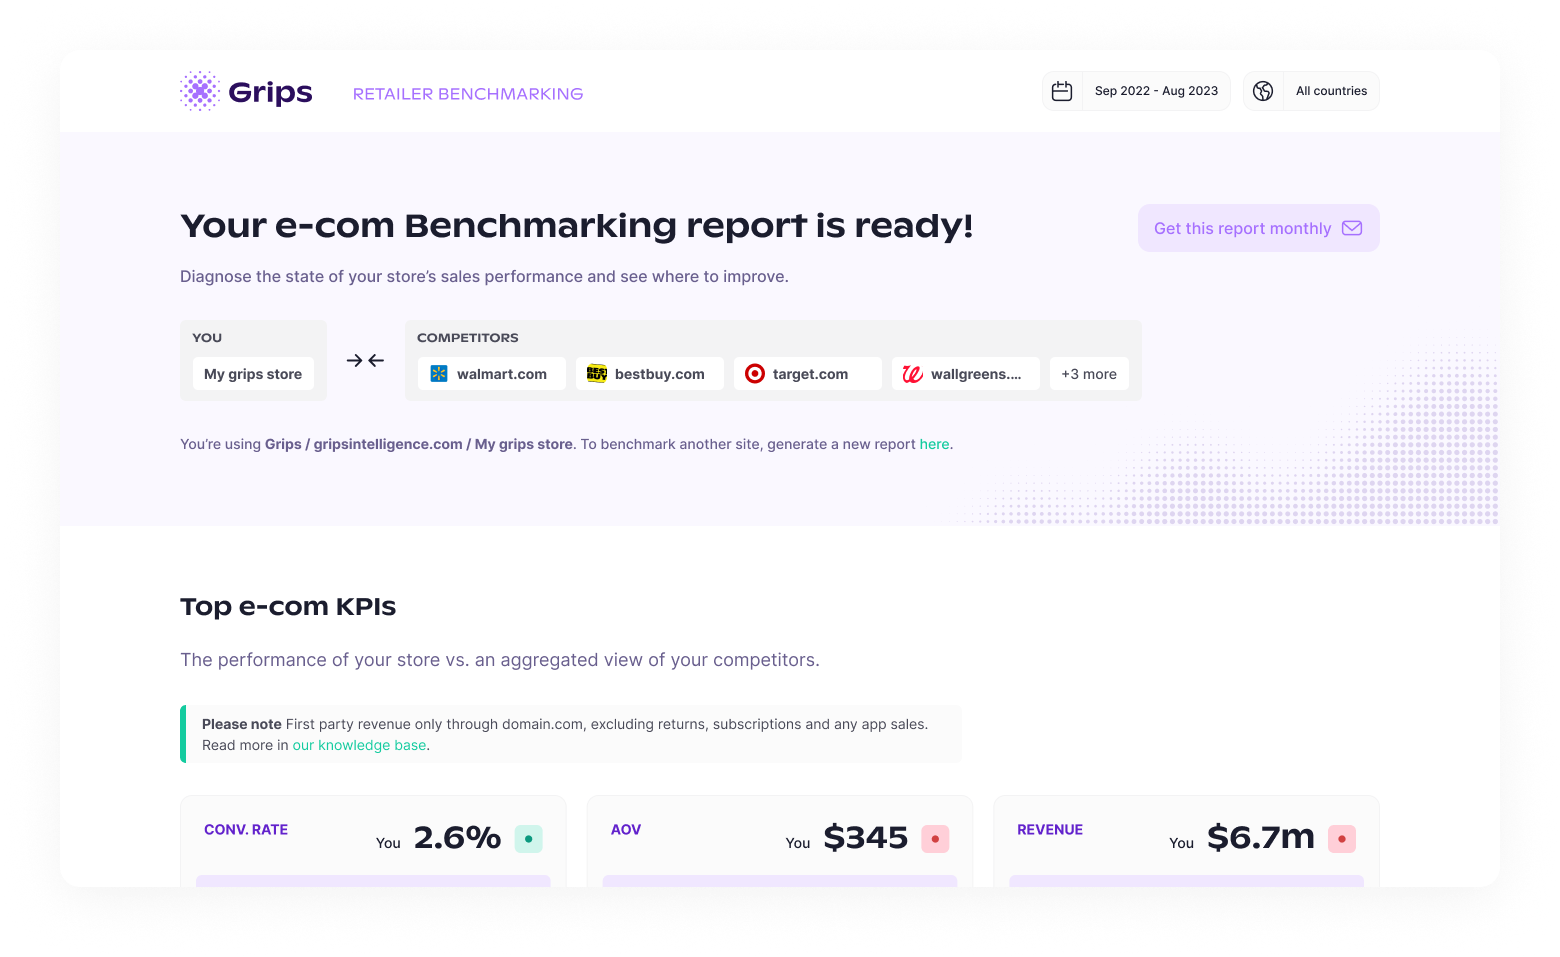
For all of these use cases, utilizing Grips eCommerce Benchmarking, with real-time, precise and relevant comparisons, is the best approach.
Internal vs external benchmarks
When benchmarking, it is important to distinguish between internal and external benchmarks.
Internal benchmarking involves measuring and comparing various components within the same scope of your business. For instance, you could assess the conversion rate of your online store this month compared to the same month last year.
External benchmarking compares your online store metrics to other relevant online stores. This process can be further categorized from different external perspectives:
- Industry benchmarks: These comparisons include your store versus an industry, which is a collection of online stores all working in the same industry.
- Competitive benchmarks: These focus on direct comparisons with your industry competitors.
Who does eCommerce benchmarking?
Ecommerce benchmarking is a practice utilized by all sellers participating in the online shopping landscape, including:
Brands
Brands who want to stay competitive often leverage ecommerce benchmarking to evaluate their online performance. This includes assessing aspects such as conversion rates, customer engagement, and overall digital presence.
Agencies
Digital marketing agencies and consulting firms frequently conduct ecommerce benchmarking to provide their clients with valuable insights. By comparing performance metrics across industries, agencies can offer tailored strategies for improvement.
Shop Owners:
Individual shop owners, whether operating small businesses or larger ecommerce platforms, engage in benchmarking to gauge their performance against industry norms. This enables them to make informed decisions and enhance their online strategies.
Marketers:
Marketing professionals utilize ecommerce benchmarking to evaluate the effectiveness of their campaigns and strategies. This practice helps marketers understand how their efforts align with industry standards and identify areas where adjustments can be made for better results.

How to set a relevant eCommerce benchmark
Setting a relevant ecommerce benchmark involves a thoughtful and strategic approach. Here’s an expansion on the key considerations:
Identify Competitors:
Begin by conducting a thorough analysis of your competitive landscape. Identify direct and indirect competitors to gain a comprehensive understanding of the market. This involves assessing their product offerings, target audience, and overall market positioning.
Define Key Performance Indicators (KPIs):
Review and list the KPIs that your ecommerce business currently uses and tracks. These could include metrics related to website traffic, conversion rates, customer acquisition costs, average order value, and customer retention. Understanding your existing KPIs sets the foundation for meaningful benchmark comparisons.
Establish Clear Goals:
Define your business goals and objectives. Determine what specific aspects of your ecommerce operations you aim to improve. Whether it’s increasing conversion rates, expanding market share, or enhancing customer satisfaction, clearly articulated goals provide a framework for benchmarking success.
Identify Weaknesses:
Reflect on areas where your business may be weaker or faces challenges. This could include aspects of the customer journey, user experience, or certain marketing channels. Recognizing weaknesses allows you to target specific areas for improvement through benchmarking.
Assess Available Data:
Take stock of the data you currently have access to. This involves analyzing internal data such as sales figures, customer behavior, and website analytics.
Evaluate Information Gaps:
Identify areas where you lack clarity or insights. Pinpoint aspects of your ecommerce operations that you find challenging to understand or areas where you require more information. These information gaps guide you towards the types of benchmarks that will be most beneficial.
Metrics to benchmark
Assessing the most appropriate key metrics is essential for optimizing performance and user engagement. Categorized into ecommerce transactional metrics and on-site engagement metrics, these indicators offer valuable insights for online stores, and all are available in Google Analytics.
Ecommerce Transactional Metrics:
Revenue:
- What it is: The total monetary value generated from transactions.
- Why it’s important: Revenue is the lifeblood of any ecommerce business. Monitoring revenue provides a clear picture of the financial health and success of the business.
Conversion Rate:
- What it is: The percentage of website visitors who made a purchase
- Why it’s important: A high conversion rate indicates the effectiveness of your marketing strategies, your product assortment, and the user-friendliness of your website, directly impacting sales.
Average Order Value (AOV):
- What it is: The average value of each transaction.
- Why it’s important: AOV helps in understanding customer spending habits, guiding pricing strategies, and identifying opportunities to increase transaction values.
Transactions:
- What it is: The total number of completed transactions.
- Why it’s important: Tracking transaction quantity provides insights into sales volume, aiding in inventory management and overall business planning.
Product Revenue:
- What it is: Revenue attributed to specific products.
- Why it’s important: Understanding which products contribute most to revenue helps in optimizing marketing efforts and product offerings.
On-Site Engagement Metrics:
On-site engagement metrics, regarded as crucial KPIs, gauge the dynamics of user interaction with your store. These metrics not only offer insights into user behavior and satisfaction but also assess the overall effectiveness of your store in captivating and sustaining user interest. Embedded within these metrics are essential User Experience (UX) benchmarks that contribute to shaping a website’s success. Here are some fundamental on-site engagement metrics:
Sessions:
- What it is: The total number of visits to your website.
- Why it’s important: Sessions indicate overall website traffic and popularity, providing a foundational metric for assessing the reach and visibility of your ecommerce store.
Bounce Rate:
- What it is: The percentage of visitors who navigate away from the site after viewing only one page.
- Why it’s important: A lower bounce rate signifies engagement and interest, indicating that visitors are finding relevant content and navigating further into your site.
Pageviews:
- What it is: The total number of pages viewed across all sessions.
- Why it’s important: Higher pageviews suggest deeper exploration and engagement, reflecting a positive user experience and interest in your website content.
Average Session Duration:
- What it is: The average amount of time visitors spend on your site.
- Why it’s important: Average session duration reflects user engagement. Longer durations generally indicate that visitors find your content valuable and are spending more time on your site.
Mobile Performance:
- What it is: Metrics related to how well your site performs on mobile devices, including mobile bounce rate and mobile page load time.
- Why it’s important: With the increasing use of mobile devices, ensuring a positive mobile experience is essential. Monitoring mobile performance metrics helps in catering to the needs of mobile users and improving overall site accessibility.
Exit Rate:
- What it is: The percentage of pageviews that are the last in a session.
- Why it’s important: High exit rates on specific pages may indicate areas that need optimization, guiding improvements in content or user experience.
Add to Cart Rate:
- What it is: The percentage of sessions where users add items to their shopping cart.
- Why it’s important: This metric gauges the effectiveness of product presentation and user intent, providing insights into the success of your product pages and calls-to-action.
Abandoned Cart Rate:
- What it is: The percentage of users who add items to their shopping cart but do not complete the checkout process.
- Why it’s important: Abandoned cart rate is a key indicator of potential revenue loss. Monitoring this metric helps identify friction points in the checkout process, enabling businesses to implement strategies to recover potentially lost sales. Common reasons for cart abandonment include unexpected costs, complicated checkout processes, or concerns about security. Addressing these issues can improve the overall conversion rate and enhance the customer experience, contributing to increased revenue and customer satisfaction.
Customer metrics
Average Repeat Customer Rate:
- What it is: the percentage of customers making more than one purchase over a specified period..
- Why it’s important:
- Loyalty Measurement: Insights into customer loyalty and satisfaction.
- Marketing Effectiveness: Reflects success in encouraging repeat purchases.
- CLV Improvement: Positive impact on Customer Lifetime Value (CLV).
- Competitive Advantage: Retaining satisfied customers for brand loyalty.
- Revenue Impact: Contribution to overall revenue and business planning.
Customer Lifetime Value (CLV):
- What it is:The total revenue a business can expect from a customer throughout their entire relationship.
- Why it’s important: Maximizes profitability, guides resource allocation, and informs customer retention strategies.
Customer Acquisition Cost (CAC):
- What it is: The average cost a business incurs to acquire a new customer, including marketing and sales expenses.
- Why it’s important: Evaluates marketing ROI, aids budget planning, and optimizes marketing channels for efficiency.
Net Promoter Score (NPS):
- What it is: A measure of customer satisfaction and loyalty based on the likelihood of customers recommending the business.
- Why it’s important: Identifies loyal customers, gathers feedback, and benchmarks against industry competitors.
Understanding and monitoring these metrics is crucial for making informed decisions, optimizing user experience, and ultimately driving the success of an ecommerce business.
Conversion Funnel
To add to the metrics to benchmark, the conversion funnel, in the context of e-commerce, represents the journey that a user takes from initially visiting a website to completing a desired action, such as making a purchase. It is a series of steps or stages that tracks user interactions and engagement throughout the process. The stages in a typical e-commerce conversion funnel include:
Step 1: Total Sessions
This is the broadest stage of the funnel and represents the total number of visits or sessions to your website. Each session begins when a user lands on your site and ends when there is no activity for a specified period (usually 30 minutes of inactivity).
Step 2: Sessions with Product Detail Page View
In this stage, users move beyond just landing on the site and navigate to specific product pages. They are actively exploring products, indicating a higher level of interest in the offerings.
Step 3: Sessions with Add to Cart
This stage represents sessions where users take a step further by adding products to their shopping cart. It indicates a strong intent to make a purchase, as users are actively selecting items they are interested in.
Step 4: Sessions with a Transaction
The final stage of the conversion funnel is the completion of a transaction. This occurs when users successfully make a purchase, providing valuable revenue for the e-commerce business.
Product level price monitoring as benchmarking
Benchmarking in the context of price monitoring involves comparing and analyzing the pricing strategies of a business against those of its competitors or industry standards. This process provides valuable insights into market dynamics, helps businesses remain competitive, and informs pricing decisions. Here’s a breakdown of how benchmarking operates in the realm of price monitoring:
Competitor Price Comparison:
Benchmarking entails regularly monitoring and comparing the prices of products or services offered by competitors in the market. This allows businesses to stay informed about the pricing landscape and adjust their own prices accordingly to maintain competitiveness.
Identifying Market Trends:
Benchmarking provides insights into broader market trends, including pricing trends. Understanding how prices fluctuate across the industry helps businesses anticipate changes and make informed pricing decisions that align with market dynamics.
Promotional Strategies:
Benchmarking helps businesses understand how competitors structure their promotions, discounts, and sales events. This knowledge enables businesses to design effective promotional strategies that attract customers without compromising profitability.
Adapting to Market Changes:
Market conditions are dynamic, and benchmarking helps businesses adapt to changes swiftly. Whether it’s a new entrant disrupting pricing norms or shifts in consumer preferences, benchmarking allows businesses to stay agile in their pricing strategies.
Benchmarking by channel
Let’s break down the main acquisition channels in Google Analytics and discuss what each channel represents and why it is important for ecommerce benchmarking:
Organic Search:
- What it is: Users who find your site through unpaid search engine results.
- Why it’s important: Organic search is crucial for assessing the effectiveness of your SEO efforts. A high organic search performance indicates strong visibility on search engines, potentially leading to cost-effective and sustainable traffic.
Paid Search:
- What it is: Users who find your site through paid advertising on search engines.
- Why it’s important: Paid search allows you to evaluate the performance of your paid advertising campaigns. Monitoring metrics such as click-through rates, conversion rates, and ROI helps optimize advertising spend and strategy.
Direct:
- What it is: Users who directly type your website URL into the browser or use bookmarks.
- Why it’s important: Direct traffic represents brand recognition and loyalty. A strong direct channel indicates a well-established brand and customer base.
Referral:
- What it is: Users who visit your site through links on other websites.
- Why it’s important: Referral traffic helps gauge the impact of partnerships, collaborations, and backlinks. Assessing the quality and quantity of referral traffic aids in optimizing partnerships and outreach efforts.
Social:
- What it is: Users who visit your site through social media platforms.
- Why it’s important: Social traffic assesses the effectiveness of your social media marketing. Understanding which social channels drive the most engaged users can inform social media strategy and content planning.
Email:
- What it is: Users who visit your site through links in emails.
- Why it’s important: Email traffic allows you to assess the performance of your email marketing campaigns. Tracking metrics like open rates, click-through rates, and conversion rates helps optimize email content and targeting.
Other:
- What it is: Users who visit your site through channels not explicitly defined in the main categories.
- Why it’s important: The “Other” category helps capture additional sources of traffic. Investigating this category can reveal new channels and opportunities for diversifying your traffic sources.
What can you do with channel benchmarks?
- Performance Comparison: Ecommerce benchmarking across these channels allows you to compare the effectiveness of each channel in driving traffic, conversions, and revenue.
- Resource Allocation: By understanding which channels perform best, you can allocate your marketing budget and resources strategically, focusing on channels that provide the highest return on investment.
- Identifying Opportunities: Benchmarking helps identify opportunities for improvement in underperforming channels and areas where you can capitalize on strengths.
- Trend Analysis: Regular benchmarking allows you to identify trends over time, helping you adapt to changes in user behavior and market dynamics.
Evaluating each acquisition channel provides a comprehensive view of your ecommerce ecosystem, enabling data-driven decision-making and the refinement of your overall digital strategy.
Benchmarking by device
Let’s delve into the main device categories in Google Analytics and discuss what each category represents and why it is important for ecommerce benchmarking:
Desktop:
- What it is: Users who access your site from traditional desktop or laptop computers.
- Why it’s important: Desktop traffic remains significant for ecommerce, especially for users engaging in extensive product research and high-value transactions. Benchmarking desktop performance helps optimize the user experience for this segment.
Mobile:
- What it is: Users who access your site from mobile devices, such as smartphones and tablets.
- Why it’s important: With the increasing prevalence of mobile browsing, benchmarking mobile performance is crucial. This category assesses the user experience on smaller screens and the effectiveness of mobile-optimized features.
Tablet:
- What it is: Users who access your site from tablet devices.
- Why it’s important: While tablet usage may not be as dominant as desktop or mobile, benchmarking this category provides insights into a specific user segment. Understanding tablet behavior helps tailor the user experience for these devices.
What can you do with device benchmarks?
- Conversion Analysis: Analyzing conversions by device helps identify any device-specific challenges or opportunities. For example, understanding if a specific device category has a higher or lower conversion rate.
- Adaptation to Trends: As user behavior shifts, benchmarking across devices helps you adapt to trends. For instance, if mobile usage is steadily increasing, it’s essential to adapt your strategy to accommodate this shift.
- Cross-Device Insights: Understanding how users move between devices (e.g., starting on mobile and completing a purchase on desktop) provides insights into the multi-device journey, informing marketing and content strategies.
- Responsive Design Evaluation: Benchmarking device performance is crucial for assessing the effectiveness of responsive design. Ensuring that your website adapts seamlessly to various devices is key for a positive user experience.
- Strategic Resource Allocation: Based on benchmarking results, allocate resources strategically. If a significant portion of your traffic comes from mobile devices, investing in mobile optimization and targeted mobile marketing may be a priority.
Evaluating ecommerce performance across different devices ensures a holistic understanding of user behavior and enables you to tailor your strategies to meet the diverse needs of your audience.
How to measure ecommerce benchmarks in Google Analytics
Google Analytics remains the standard in web analytics. Here’s how to use GA4 for ecommerce benchmarking:
Set Up GA4 Property:
Create a new GA4 property for your ecommerce website in your Google Analytics account.
Enable Ecommerce Reporting:
In the GA4 interface, go to the property you’ve created. In the left-hand menu, navigate to “Events,” and then click on “Ecommerce.” Enable Ecommerce reporting for your property.
Configure Ecommerce Settings:
Set up ecommerce settings in GA4 by configuring your data streams, selecting relevant currency and time zone, and enabling Enhanced Measurement for ecommerce events.
Explore Ecommerce Reports:
Access the “Analysis” section in GA4 and explore the pre-built reports for ecommerce under the “Ecommerce” category. Key reports include “Shopping Behavior,” “Checkout Behavior,” and “Product Performance.”
Utilize User Explorer:
Take advantage of the “User Explorer” report to drill down into individual user journeys. This helps in understanding the behavior of specific users and identifying patterns.
Custom Reports in Analysis Hub:
Leverage the “Analysis Hub” to create custom reports tailored to your ecommerce benchmarks. Use this feature to build custom analyses based on your specific goals.
Enhanced Conversions:
Explore “Conversions” in GA4 to access enhanced conversion reports. This includes data on total revenue, conversion rates, and other ecommerce-related metrics.
Acquisition Channels:
Analyze the performance of different acquisition channels in GA4. Navigate to the “Acquisition” section to understand how users are reaching your ecommerce site.
Device and Platform Reports:
Evaluate performance across different devices and platforms. The “Technology” section provides insights into the devices, operating systems, and browsers used by your audience.
Event Tracking:
Leverage GA4’s event tracking capabilities to monitor specific ecommerce events, such as product views, add to cart actions, and completed purchases.
Audience Reports:
Explore the “Audience” reports to understand user demographics, interests, and behaviors. This information can help tailor marketing strategies and content.
Time Period Comparison:
Use the date range selector in the upper right corner to compare ecommerce performance over different time periods. This is essential for identifying trends and seasonality.
Custom Dimensions and Metrics:
Implement custom dimensions and metrics to capture additional data specific to your ecommerce benchmarks. This allows for a more tailored analysis.
Conversion Modeling:
Take advantage of GA4’s machine learning capabilities for conversion modeling. This can provide insights into potential future customer behavior.
Export and Share Reports:
Export relevant reports or share them with stakeholders to facilitate collaborative analysis and decision-making.
By leveraging the features and reports available in GA4, ecommerce benchmarking becomes more powerful and adaptable to your specific business goals. Regularly explore the interface, customize reports, and utilize advanced analytics tools to gain deeper insights into your ecommerce performance.
Google Analytics: Evolution of Benchmarking
In the era of Universal Analytics, Google Analytics provided a valuable Benchmarking tool that allowed users to compare their website’s performance metrics against industry averages. This feature served as a strategic compass, offering insights into how a website’s metrics stacked up against peers in the same industry. Businesses could identify areas of strength and pinpoint aspects requiring improvement, enabling informed decision-making.
However, with the evolution to the current version of Google Analytics (GA4), currently there isn’t a benchmarking report. Under GA4 account settings, it is possible to agree to contribute your data to benchmarks. But, there isn’t yet a benchmarking report to view in GA4.
2023 eCommerce Benchmarks: A Comprehensive Look at eCommerce Trends.
Explore eCommerce statistics and KPI benchmarks to see how your store stacks up. Grips has prepared helpful insights from data aggregated across $80B+ in tracked monthly ecommerce revenue. All data is from 2023 and all AOV values are in USD.
Conversion rates by ecom shopping platform
| shop platform | conversion rate |
| bigcommerce | 2.01% |
| custom | 1.86% |
| demandware | 1.97% |
| magento | 1.74% |
| sap | 1.95% |
| shopify | 2.19% |
| square space | 2.43% |
| woocommerce | 1.89% |
Conversion rates by vertical
| vertical | conversion rate |
| adult | 1.82% |
| arts and entertainment | 1.93% |
| business and consumer services | 2.76% |
| community and society | 2.39% |
| computers electronics and technology | 1.56% |
| e-commerce and shopping | 1.99% |
| finance | 2.26% |
| food and drink | 3.04% |
| gambling | 2.75% |
| games | 2.01% |
| health | 2.82% |
| heavy industry and engineering | 1.47% |
| hobbies and leisure | 1.78% |
| home and garden | 1.51% |
| jobs and career | 2.86% |
| law and government | 2.19% |
| lifestyle | 2.01% |
| news and media | 2.11% |
| pets and animals | 2.96% |
| reference materials | 2.49% |
| science and education | 2.02% |
| sports | 1.82% |
| travel and tourism | 2.46% |
| vehicles | 1.38% |
Conversion rates by devices
| device | conversion rate |
| desktop | 2.56% |
| mobile | 1.77% |
Conversion rates by channels
| channel | conversion rate |
| Direct | 2.20% |
| Organic Search | 1.54% |
| Paid Search | 2.12% |
| Referral | 3.57% |
| Social | 1.34% |
Conversion rates by countries
| country | conversion rate |
| US | 2.15% |
| UK | 2.10% |
| DE | 2.06% |
| CA | 2.11% |
| IN | 2.15% |
| BR | 2.05% |
| FR | 2.03% |
| AU | 2.08% |
| ES | 2.13% |
| MX | 2.06% |
AOV by ecom shopping platform
| shop system | aov |
| bigcommerce | $158.22 |
| custom | $112.19 |
| demandware | $137.68 |
| magento | $198.86 |
| sap | $176.46 |
| shopify | $114.84 |
| square space | $115.47 |
| woocommerce | $140.69 |
AOV by vertical
| vertical | aov |
| adult | $98.65 |
| arts and entertainment | $129.55 |
| business and consumer services | $231.31 |
| community and society | $94.31 |
| computers electronics and technology | $276.38 |
| e-commerce and shopping | $115.63 |
| finance | $175.05 |
| food and drink | $86.39 |
| gambling | $97.52 |
| games | $111.69 |
| health | $98.86 |
| heavy industry and engineering | $407.99 |
| hobbies and leisure | $153.86 |
| home and garden | $248.66 |
| jobs and career | $193.49 |
| law and government | $168.06 |
| lifestyle | $111.28 |
| news and media | $85.46 |
| pets and animals | $81.73 |
| reference materials | $103.14 |
| science and education | $186.99 |
| sports | $163.96 |
| travel and tourism | $152.03 |
| vehicles | $317.70 |
AOV by devices
| device | aov |
| desktop | $143.43 |
| mobile | $118.75 |
AOV by channels
| channel | aov |
| Direct | $146.27 |
| Organic Search | $143.44 |
| Paid Search | $140.79 |
| Referral | $145.12 |
| Social | $134.60 |
AOV by country
| country | aov |
| US | $123.55 |
| UK | $128.09 |
| DE | $125.35 |
| CA | $128.90 |
| IN | $125.79 |
| BR | $147.64 |
| FR | $133.00 |
| AU | $130.74 |
| ES | $125.01 |
| MX | $140.66 |
Revenue shares by devices
| device | revenue share |
| mobile | 43% |
| desktop | 57% |
Revenue shares by channels
| channel | revenue share |
| Organic Search | 31% |
| Referral | 12% |
| Paid Search | 3% |
| Direct | 51% |
| Social | 3% |