article

Top Home & Garden digital companies to watch: Free read

Read this exclusive report revealing competitive intelligence on the Furniture category in the US, UK and Germany, including total e-commerce revenue, best-selling categories, top retailers, pricing and more.
John Fetto
12 min read
22 March 2024

Introduction

Top Home & Garden sites to watch

In the fast-evolving landscape of the $60 billion home and garden e-commerce category, certain digital companies are setting the pace, reshaping how consumers enhance their living spaces. Our latest report delves into this dynamic sector, spotlighting the top digital companies to watch in the U.S. By analyzing critical metrics like e-commerce revenue, best-selling categories and the top performing marketing channels, we offer an unparalleled glimpse into the market’s current leaders and emerging trends.

From innovative product offerings to strategic marketing approaches, these companies are not just riding the wave of digital transformation; they are creating it. Whether it’s through groundbreaking product introductions or savvy digital marketing campaigns, the insights provided reflect a sector that’s not just growing, but thriving in its ability to meet and exceed consumer expectations. For industry professionals and enthusiasts alike, this report is a compass pointing towards the future of home and garden e-commerce.

You can also download a PDF of the report here.


AeroPress.com

aeropress.com top home and garden sites to watch

A longtime favourite of coffee enthusiasts, AeroPress is courting new consumers such as dorm-dwellers as well as introducing new products resulting in a surge in revenue.

KPIs
January – December, 2023 US vs year prior

aeropress.com e-commerce KPIs 2023
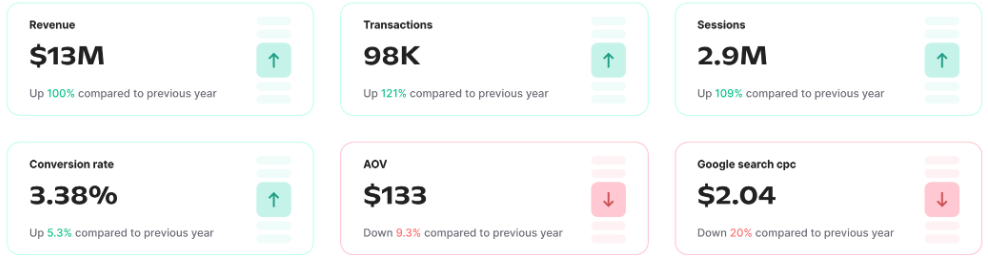
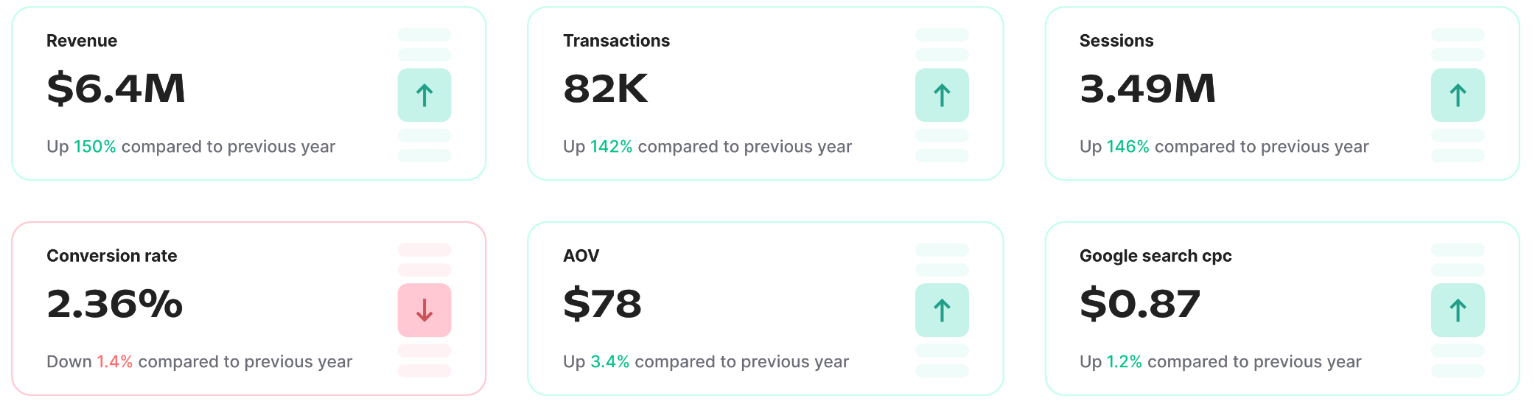
Grips reports that DTC sales on AeroPress.com reached $6.4 million in 2023 in the United States with revenues percolating up remarkable 150% over 2022 levels.
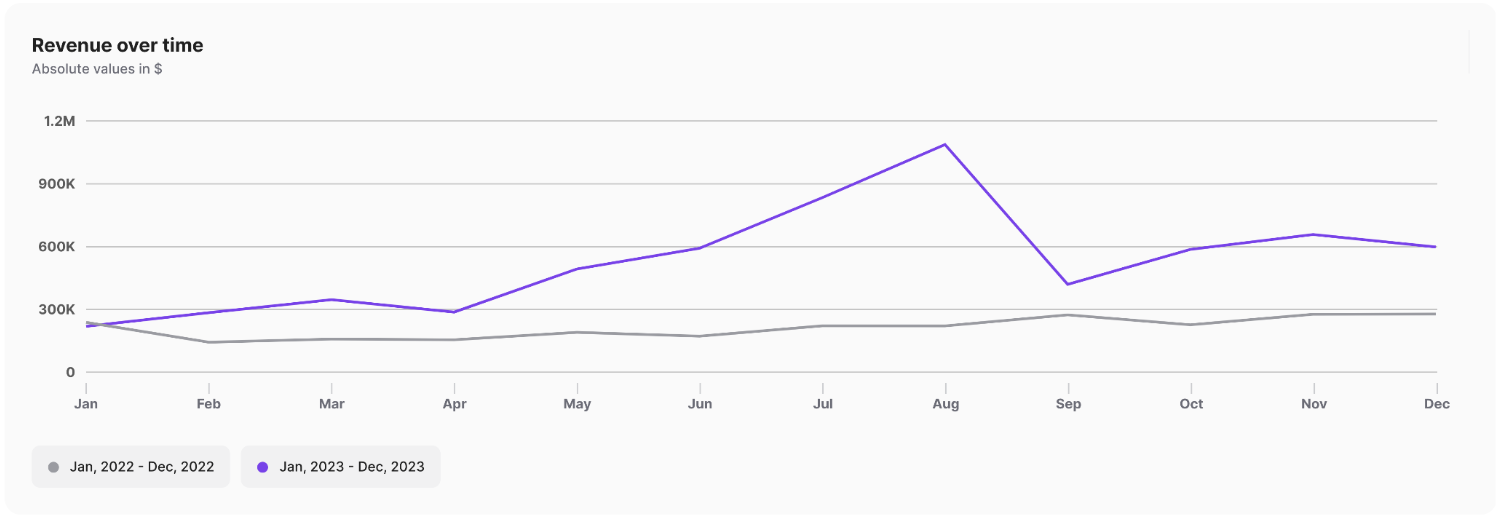
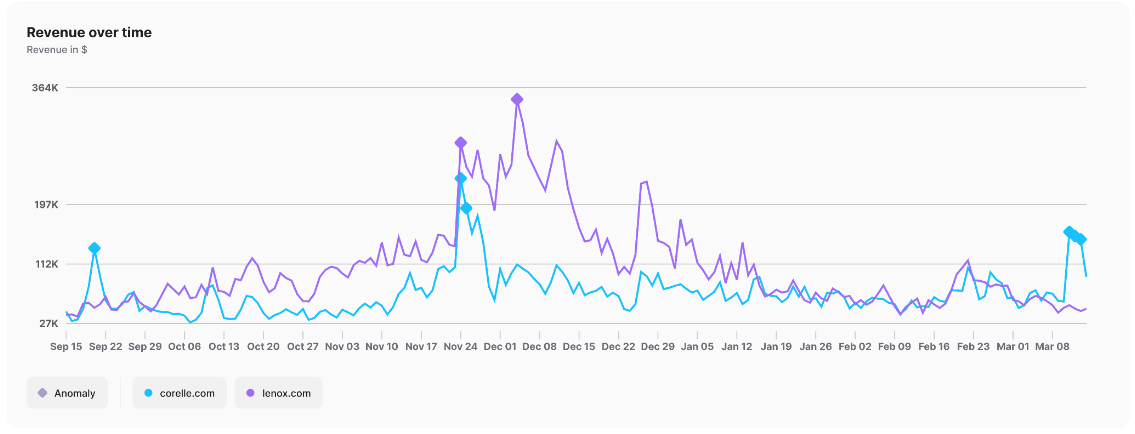
The average purchase on the site, which sells their signature AeroPress devices as well as accessories and compatible products, came to $78 last year, up from $75 in 2022. Despite efforts to introduce the brand to new consumers, the site’s conversion rate has held remarkably steady.

Monthly Revenue
January – December, 2023 US vs year prioraeropress.com e-commerce monthly revenue 2023
Much of AeroPress.com’s 2023 growth can be attributed to a late-summer promotion aimed at the back-to-campus crowd which drove monthly revenues to to an all-time high of $1.1 million. Following that mega jolt in sales, revenues in Q4 remained well above average. In fact, US sales on AeroPress.com were 136% higher than the same period in 2022. 

Top Retailers
January – December, 2023 USTop retailers selling aeropress
Purchases via AeroPress.com account for just under 93% of sales of AeroPress branded products. Amazon accounted for the lion’s share of non-DTC sales in 2023, but more consumers are now going to Aeropress as Amazon’s share of revenues fell from 13.7% in Q4 2022 to just 6.6% in Q4 2023. Furthermore, consumers are more likely to be picking up replacement filters on Amazon given the average price is half that of AeroPress.com.

Competitor Comparison: Wacaco
January – December, 2023 USmonthly e-commerce revenue for wacaco brand
AeroPress doesn’t face a ton of competition given their unique niche, but Grips is tracking at least one rival: Wacaco. Similar to AeroPress, online sales of Wacaco-brand coffee makers grew steadily in 2023. However, Q4 sales were down 14% versus 2022.

Marketing Channels
January – December, 2023 US vs year priorgoogle search ad spend and digital marketing channels and driving revenue to aeropress.com
AeroPress.com’s hardest working digital marketing channel is Referrals which converts an estimated 4.6% of traffic. Grips also reveals that Paid Search was a heavy driver of the brand’s summer promotion with their July Google ad spend coming in at fully three times higher than a typical month in 2023. 

HarborFreight.com

harborfreight.com top home and garden sites to watch

Harbor Freight may specialize in tools and equipment, but a significant share of revenue comes from Home & Garden. And revenues are up across the board making Harbor Freight a growing contender in this category. 

KPIs
January – December, 2023 US vs previous year

harborfreight.com e-commerce KPIs 2023Revenue on HarborFreight.com surged to an impressive $1.3 billion in 2023, marking a 24% increase compared to the previous year. This growth was primarily due to a notable increase in sessions which were up 16% year-over year. 

But Harbor Freight had a good year overall with all metrics from conversion rate to average order value trending positive contributing to their revenue growth. 

Monthly Revenue
January – December, 2023 US vs year priorharborfreight.com e-commerce monthly revenue 2023
Harbor Freight started out 2023 with higher sales but widened the gap in the second half of the year when sessions growth took off. In fact, overall revenues for HarborFreight.com were up just 16% year-over-year in Q1 but sales were up 55% in Q4.

Category Performance
January – December, 2023 US harborfreight.com revenue by category
While Hardware accounts for 64% of their e-commerce revenue, Harbor Freight generated nearly 11% of online sales from 2.9 million Home & Garden products in 2023. Among Home & Garden sales, Lawn & Garden products make up nearly two-thirds of category revenues, bringing in $24 million, during this time period.

Competitor Comparison
November 2023 – February 2024 US monthly revenue harborfreight.com lowes.com menards.com northerntool.com acehardware.com
Harbor Freight’s main competitors are hardware and tool retailers. After Lowes.com, HarborFreight.com has the second highest market share in the United States against their core comp set (excluding Home Depot). And their share is rising. In November, Harbor Freight claimed just 13% of revenue, but in January the share rose to 16% coinciding with their liquidation sale, indicated on the chart with a yellow diamond.

Marketing Channels
January – December, 2023 US digital marketing channels and driving revenue to aeropress.com
The largest share of HarborFreight.com’s revenue comes from Direct and Organic Search. But Grips noted an uptick in revenue from both Direct and Referrals (the two best converting channels) in November and December contributing to a strong Q4 performance.

SchoolHouse.com

schoolhouse.com top home and garden sites to watch

SchoolHouse.com has become a notable contender in the Home & Garden category, with a significant share of revenue stemming from this sector as well as Furniture. 

KPIs
January – December, 2023 US vs year prior

schoolhouse.com e-commerce KPIs 2023Revenue on SchoolHouse.com increased by a substantial 83% in 2023 compared to the previous year to $82 million. With all the key KPIs increasing from sessions (up 71%) to average order value (up 6.5%) to conversion rate (up 0.53%), School House got top marks on their 2023 report card. 

Monthly Revenue
January – December, 2023 US vs year priorschoolhouse.com e-commerce monthly revenue 2023
School House started 2023 with revenue pegging just slightly above the previous year until April. Then things started to change with Q2 revenues up nearly $9 million versus the previous year, marking a 81% increase. Q4 saw the most substantial improvement though, with revenues up 132% YoY without the pronounced drop in sales in December.

Category Performance
January – December, 2023 US schoolhouse.com home and garden revenue by subcategory
Home & Garden generated 39% of e-commerce revenue for School House in 2023 with unit sales from the category topping 233,000. In Q4, Home & Garden sales were up 143% over the previous year. Lighting products made up 44% of category revenue but Linens and Bedding sales posted stronger growth with sales up more than 200%.

Competitor Comparison: Lighting
October – December 2023 US schoolhouse.com lighting competitors perigold.com westelm.com birchlane.com cb2.com
Retailers with a similar assortment and revenue to School House include Perigold, West Elm, Birch Lane and CB2. Looking at their respective Q4 revenues from the Lighting category (School House’s largest Home & Garden sector), we see that School House saw Lighting revenues increase by 122% YoY moving them into third place. Birchlane was the only similar competitor to post growth (9%) while all others declined. 

Marketing Channels
January – December, 2023 US google search ad spend and digital marketing channels and driving revenue to schoolhouse.com
The largest percentage of SchoolHouse.com’s revenue comes from Direct. But Grips noted an increase in revenue coming from Referrals and Paid Search in H2. Referrals are School House’s best converting channel. Grips also reports that SchoolHouse.com saw Google Paid Search spend more than triple in 2023 versus 2022. 

BollandBranch.com

bollandbranch.com top home and garden sites to watch

Recognized for its high-end bedding and linens, BollandBranch.com is a growing presence in the Home & Garden category solidifying its position as a key player in enhancing bedrooms and bathrooms.

KPIs
January – December, 2023 US vs previous year

bollandbranch.com e-commerce KPIs 2023Boll & Branch had a very good 2023. Among key e-commerce metrics, revenue (+25%), transactions (+19%) and sessions (+22%) increased dramatically. Average order value even increased by a respectable 4.9% compared to the year prior. The large growth did, however, create a slight drag on conversion rate which dipped by 2.5%. 

Quarterly Revenue
January – December, 2023 US vs year prior
quarterly revenue bollandbranch.com
Despite starting the year below prior year’s levels, BollandBranch.com demonstrated a remarkable turnaround, progressively widening the gap as the year unfolded. While facing a drop in revenues in Q1, the company saw sales steadily increase from Q2 onwards culminating in an impressive 47% growth rate in Q4, propelled by robust performance during the holiday period showcasing the company’s resilience and adaptability in navigating market challenges.

Category Performance
August – December, 2023 US 

bollandbranch.com home and garden revenue by subcategory
While the Furniture is the biggest revenue driver for BollandBranch.com, the Home & Garden category, lead by Linens & Bedding, represented 34% of 2023 sales and is growing. In Q4, the category grew by 59% YoY, faster than the site overall.

Competitor Comparison: Linen & Bedding
October – December 2023 US bollandbranch.com competitors linen and bedding brooklinen.com saatva.com coyuchi.com schoolhouse.com
Boll & Branch’s most direct competitors include similar sites specializing in high-end Linen &  Bedding with an average price above $125. Among the top competitors, only Boll & Branch and School House (one of our other Home & Garden sites to watch) saw YoY increases in Linen & Bedding revenues in Q4 (50% for Boll & Branch and 212% for School House).  

Device Performance
January – December, 2023 US bollandbranch.com mobile versus desktop performance versus competitors
BollandBranch.com has a lower conversion rate versus most Home & Garden competitors, but its mobile conversion rate is something to watch. Specifically, while Boll & Branch’s desktop conversion rate is 25% lower than average, their mobile conversion rate is only 17% lower, indicating a strong mobile conversion funnel. 


Lenox.com

lenox.com top home and garden sites to watch

This classic brand has positioned itself as a major player in the online Home & Garden sector, with impressive DTC revenue growth in tableware, glassware and beyond.

KPIs
January – December, 2023 US vs previous year

lenox.com e-commerce KPIs 2023Revenue on Lenox.com grew to $24 million in 2023, up 28% compared to the previous year. While most KPIs, including transactions (+34%), sessions (+32%) and conversion rate (+2.3%) all increased, average order value fell by nearly 6%. For a company that’s almost as old as the automobile, that’s a pretty solid e-commerce performance.

Monthly Revenue
January – December, 2023 US vs year priorlenox.com e-commerce monthly revenue 2023The first seven months of 2023 saw Lenox’s revenues track almost perfectly to the year prior. However, in September things started to change. The second half of the year saw a rallying improvement with revenues up 19% in Q3 and 69% in Q4. This was driven by a sharp increase in sales concentrated between Thanksgiving and New Years when daily sales reached as high as $341,000 thanks to ongoing sales and periodic giveaways. 

Category Performance: Tableware
January – December, 2023 US
lenox.com tableware revenue by subcategory
Tableware products accounted for 37% of us sales on Lenox.com in 2023 with a fairly even split between Drinkware, Flatware and Serveware. While Food Storage Containers accounted for just 3.5% of revenue, it was among the fastest growing in Q4 with sales increasing nearly 2.3 times higher than the year prior. By comparison, Tableware, collectively, was up 1.4 times. 

Competitor Comparison: Corelle
January 2023 – December 2023 US
corelle.com lenox.com daily revenue
Lenox.com has little direct competition from similar DTC brands, as most of their products are sold through retail partners. However, Corelle.com is one exception. Grips reports that in 2023, Corelle.com generated $15 million in US sales (compared to Lenox.com’s $23 million).  The daily revenue comparison chart below shows how Lenox was able to beat Corelle. While daily sales were fairly close before and after the holiday season, Lenox.com saw sales far higher than Corelle.com for most of the months of October, November and December. During these months, Lenox was more reliant on Direct traffic to drive sales while Corelle relied more on Organic Search. More recently, Corelle took the lead with revenues up sharply due to a mid-March sale. 

NaturalLife.com

naturallife.com top home and garden sites to watch

With increasing revenues across various categories, NaturalLife.com emerges as a formidable player in Home & Garden, offering unique and eco-friendly solutions for enhancing indoor and outdoor living spaces.

KPIs
January – December, 2023 US vs previous yearnaturallife.com e-commerce KPIs 2023NaturalLife.com experienced significant growth in 2023, reflecting positive trends across key e-commerce metrics. Overall, US revenue surged to $57 million, marking an impressive 56% increase compared to the previous year, driven by an even more substantial upticks in sessions. This rapid expansion resulted in a slight dip in conversion rate by 0.5% and AOV dropped by one dollar. 

Monthly Revenue
January – December, 2023 US vs previous yearnaturallife.com e-commerce monthly revenue 2023
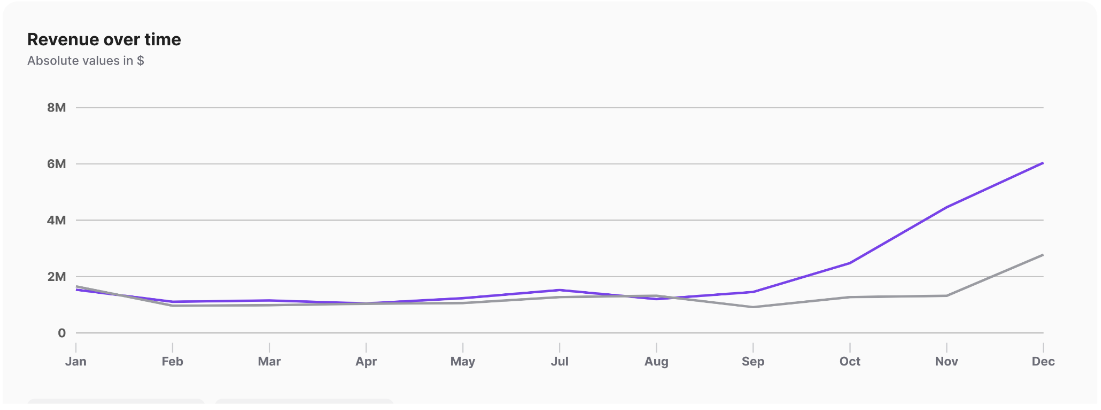
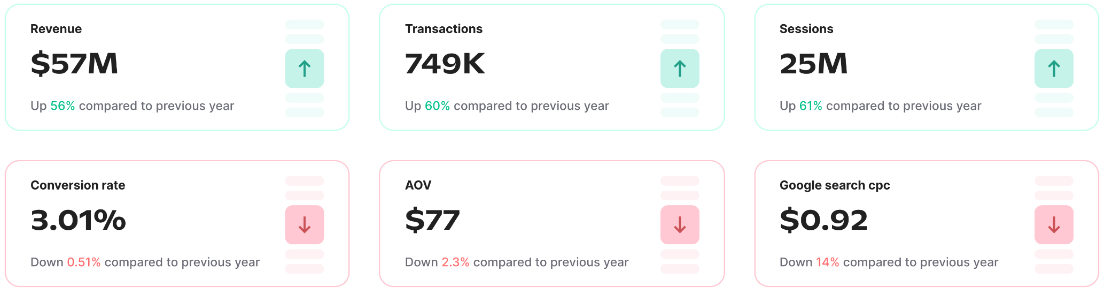
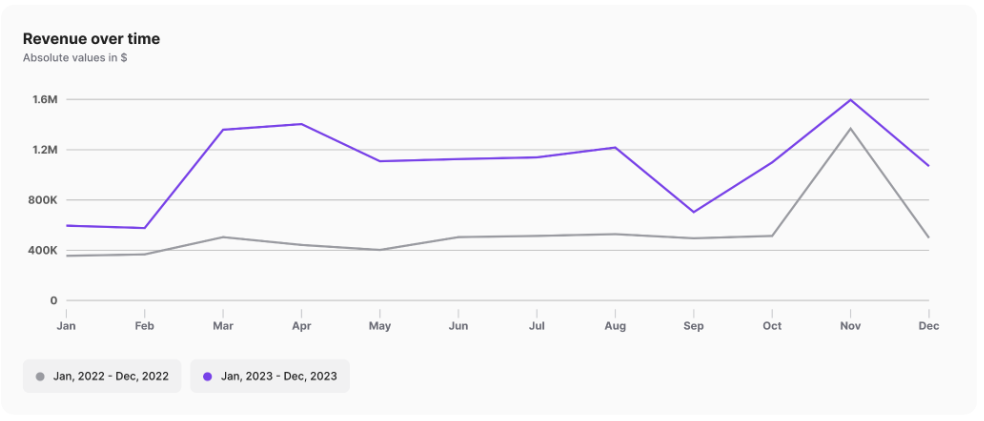
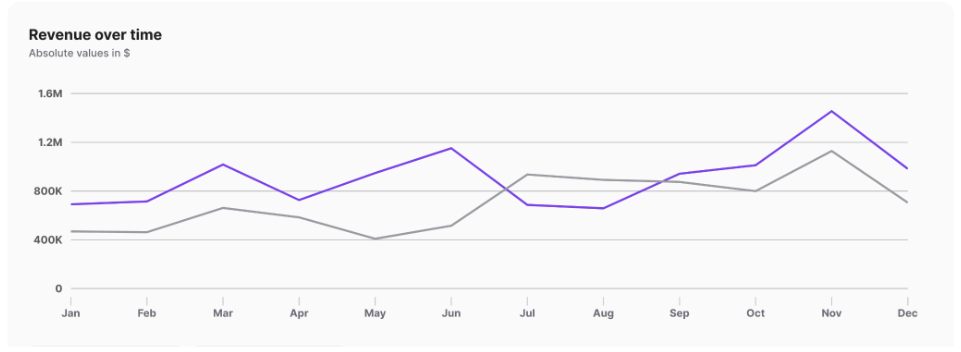
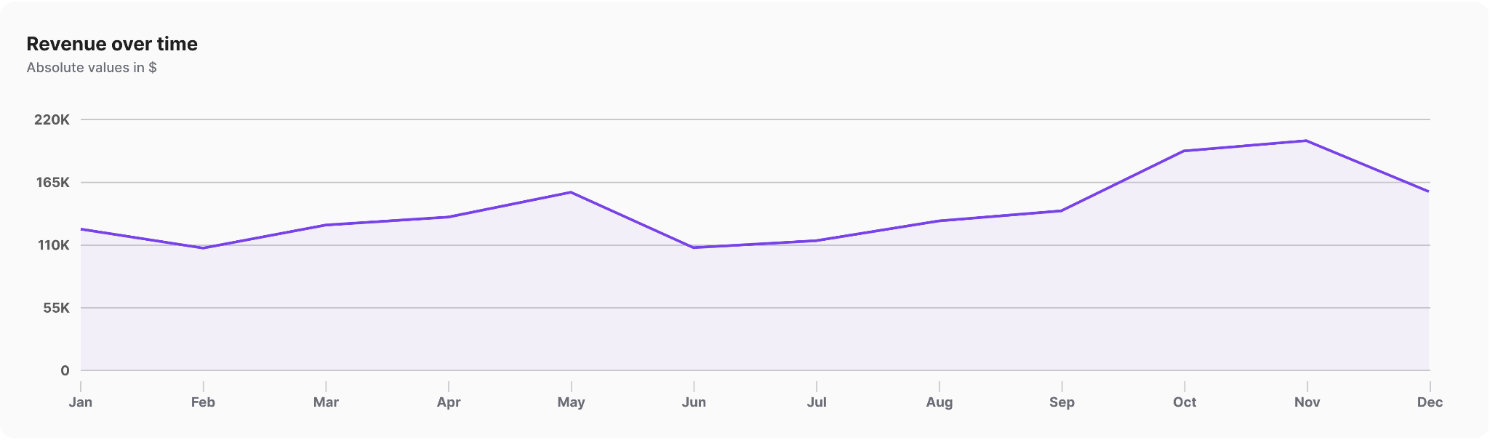
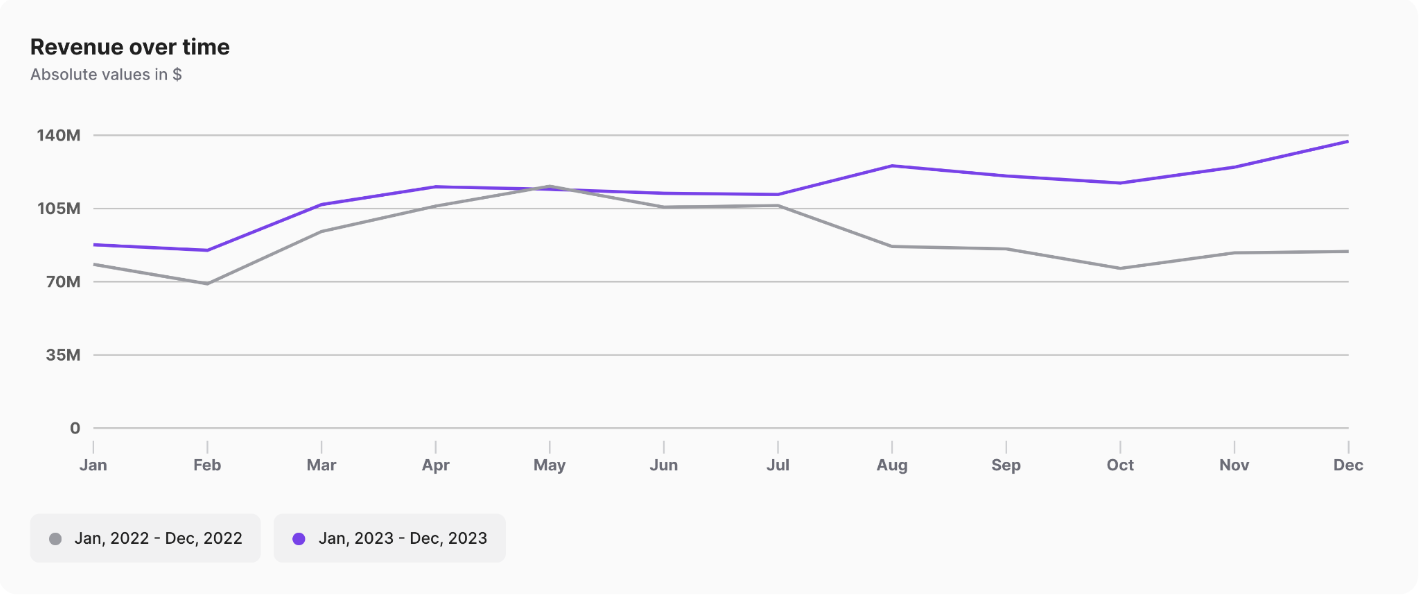
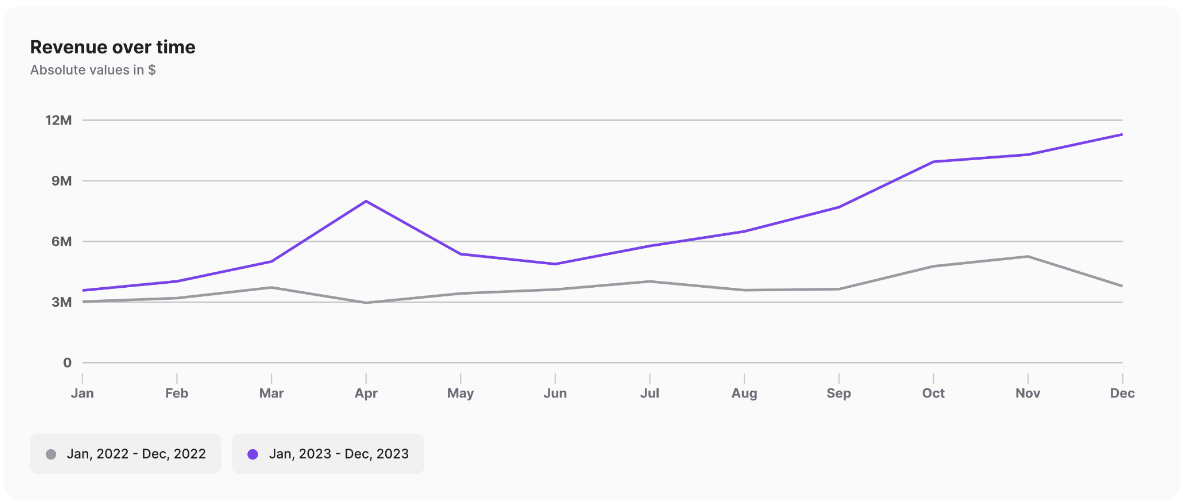
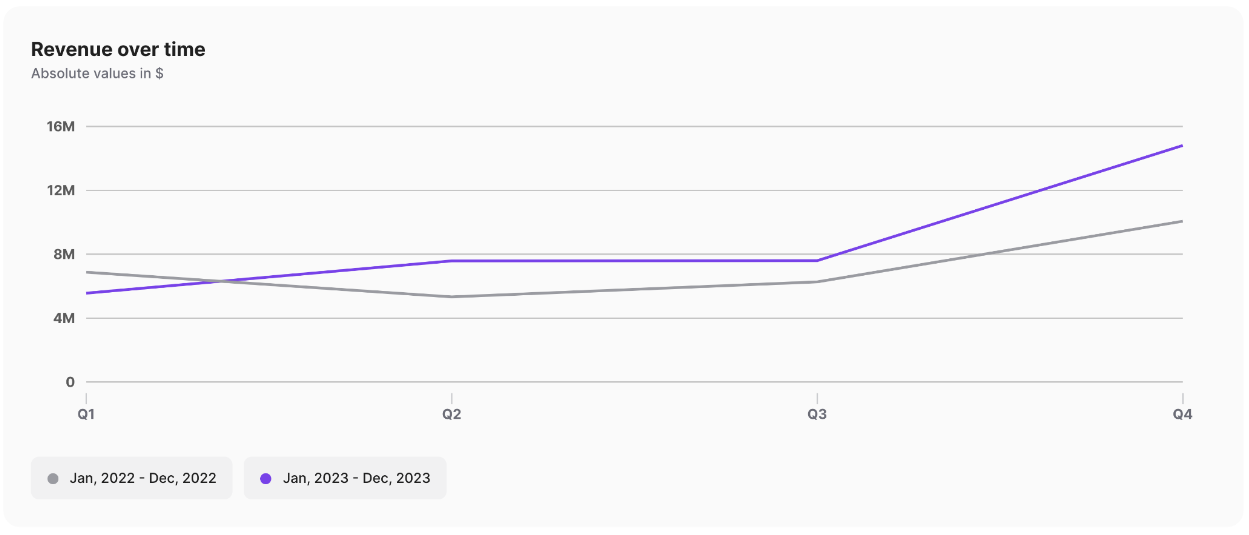
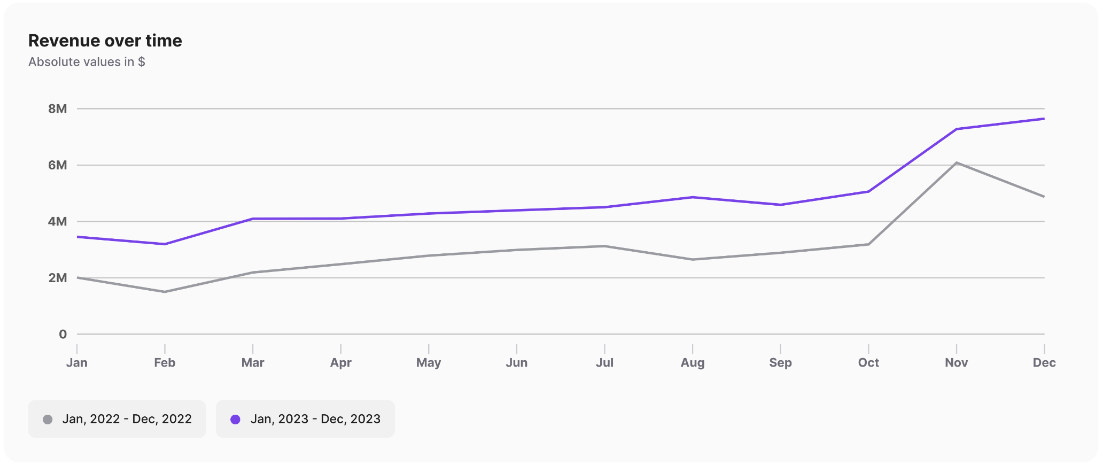
Natural Life started out 2023 with a strong lift in sales over 2022 with Q1 revenues up 89% YoY, the result of a surge in sales which began in H2 2022. This momentum slowed slightly, but sales were consistently up by 41% or more each quarter. Even during the holiday period, the company maintained impressive growth, recording a 57% increase in sales in December compared to 2022. Coincidentally, this is when Home & Garden sales surged. 

Category Performance
January – December, 2023 US
naturallife.com revenue by category
The Home & Garden category accounted for a third of Natural Life’s e-commerce revenue in 2023 generating nearly 19 million in sales, up 25% YoY. Bedding was the dominant driver of the category accounting for 71% of their Home & Garden sales followed by Tableware and Barware which collectively accounted for another 19% of Home & Garden revenues in 2023.  

Seasonal Performance
January 2023 – December 2023 US
naturallife.com monthly home and garden revenue by subcategory
While bedding accounts for a dominant share of Natural Life’s Home & Garden sales, Q4 is when this category really takes off. In Q4 2023, Bedding accounted for 79% of Home & Garden revenues (20% of total sales). Between Q1 and Q3, however, bedding accounted for only 65% of category sales (11% of sales sitewide). Furthermore, NaturalLife.com had one of their best days of the year on December 13th generating $330,000 in daily sales when they promoted their “Mix + Match” sheets and the availability of new patterns. 

ThermoWorks.com

thermoworks.com top home and garden sites to watch

ThermoWorks.com provides a wide range of professional temperature measuring instruments for industries like food service and healthcare. But their kitchen thermometer business, specifically, soared last year making them a company to watch. 

KPIs
January – December, 2023 US vs previous year
thermoworks.com e-commerce KPIs 2023
In 2023, ThermoWorks.com experienced respectable growth across key e-commerce metrics compared to the previous year with revenue up 10% and AOV up 3.6%. While the lion’s share of ThermoWorks’ assortment is more geared towards industrial and scientific settings, it was their kitchen tools that we’re most focused on. In fact, the sales of their products in the Home & Garden category, specifically kitchen and grilling thermometers, reached 11 million in 2023 and sales in Q4 were up 34% YoY due to the popularity as gifts.

Monthly Revenue
January – December, 2023 US vs year prior
thermoworks.com monthly revenue by category
Much of ThermoWorks growth was concentrated in Q4 when overall revenues were up 30% YoY. The chart below breaks down monthly sales by leading product categories and illustrates the importance of the Q4 performance which accounted for 37% of annual sales. Home & Garden products saw a strong spike around the holidays with November and December sales 114% higher than September and October.    

Competitor Comparison: Meater
January 2023 – December 2023 US 
thermoworks.com meater.com daily revenue
One of the closest competitors to ThermoWorks.com, according to Grips, is Meater.com. During the last six months of 2023, Meater.com generated $9.1 million in US sales versus ThermoWorks.com’s’ $19 million. However, their daily sales are highly correlated with both experiencing spikes at similar times (see below). 

Despite Meater generating fewer DTC sales than ThermoWorks, Grips reports that the Meater+ was the fifth best selling products on Amazon.com during November and December with an estimated $31 million in sales on Amazon alone. By comparison, ThermoWorks proudly boasts that you can’t find their products on Amazon. 

Marketing Channels
January – December, 2023 US
thermoworks.com monthly Google search ad spend
Interestingly, ThermoWorks.com’s Q4 sales were achieved with virtually no investment in Paid Search. Compared to Q4 2022, ThermoWorks saw their Google search ad spend drop by 89%. Most of their revenues were generated by Organic Search and Direct traffic but Referrals, their best converting channel made accounted for a fifth of sales last year. 

ClearlyFiltered.com

clearlyfiltered.com top home and garden sites to watch

ClearlyFiltered.com is a growing player in the home water filtration category, offering essential water filtration solutions such as pitchers, shower head filters and water bottles, with a focus on ensuring clean and safe water consumption and usage.

KPIs
January – December, 2023 US vs previous year
clearlyfiltered.com e-commerce KPIs 2023
In 2023, ClearlyFiltered.com experienced remarkable growth across key e-commerce metrics compared to the previous year with US revenue surging to $13 million, fully double their 2022 sales. The revenue jump was driven by an even larger increase in sessions boosted further by a higher conversion rate. AOV fell, however, by 9%, or about $10, which caused a bit of a drag on overall sales. 

Monthly Revenue
January – December, 2023 US vs previous year
clearlyfiltered.com monthly revenue
Clearly Filtered’s e-commerce performance was somewhat irregular. Eschewing seasonal shopping patterns, some months sales up over 200% YoY (April) while others (September and November) were up by less than 50% versus the same period in 2022. Months where the difference was greatest tended to be times when ClearlyFiltered.com spent more on Google Paid Search Ads or generated a greater share of revenue from Referrals.

Category Performance
January – December, 2023 US

Clearly Filtered’s revenue is split between Filters (shown as Hardware below) and Pitchers and Water Bottles (shown as Home & Garden below). In 2023, Pitchers and Water Bottles accounted for 75% of the site’s revenue while filters (including replacements and filtration systems), accounted for 25%. The lower revenue from Filters was not due to a lower price; in fact, Filters cost, on average, $107 while Pitchers and Water Bottles cost $94. In 2023, ClearlyFiltered.com sold 102,000 units of Pitchers and Water Bottles and 31,000 Filters. 

Competitor Comparison
January 2023 – December 2023 US 

clearlyfiltered.com competitor revenue springwellwater.com aquasana.com reverseosmosis.com rkin.com
There are a growing number of companies catering to consumer demands for in-home water filtration, whether that’s entire filtration systems or bottles and pitchers that filter tap water. The table below shows how ClearlyFiltered.com stacks up to four similar site. While all sites have shown YoY growth, Clearly Filtered surpassed the average. ReverseOsmosis.com and RKIN.com grew by even more (2.3X and 4.3X, respectively, but with revenues that are much lower than that of Clearly Filtered. If Clearly Filtered doubles again in 2024, it will pass SpringWellWater.com, the top DTC competitor. 

BranchBasics.com

branchbasics.com top home and garden sites to watch

BranchBasics.com, is a purely DTC brand dedicated to providing non-toxic and eco-friendly household cleaning products. Their range of cleaners ensures a safer environment for both humans and nature, making them a pivotal resource for promoting sustainability and health within the Home & Garden category.

KPIs
January – December, 2023 US vs year prior
branchbasics.com e-commerce KPIs 2023
BranchBasics.com posted notable improvements across in 2023, across every major e-commerce KPI compared to the previous year. Revenue rose to $11 million, reflecting a significant 30% increase. While sessions explain the bulk of that growth, the increase in conversion rate and AOV created the perfect conditions for sales to soar.

Monthly Revenue
January – December, 2023 US vs year prior
branchbasics.com monthly revenue
Despite an overall solid year, Branch Basics had a couple of troubled months. Specifically, July and August were months where revenues fell below those of 2022. That said, Branch Basics demonstrated resilience and adaptability throughout the rest of the year when most months surpassed previous year’s sales by 25% or more, including May and June when sales were more than double. These months stood out as well when looking at the mix of marketing channels driving sales. In May, BranchBasics.com saw a jump in Direct revenue while June was the top month for Paid Search, illustrating the ability of different channels to drive sales. Interestingly, while many eco-conscious brands have a strong social media presence, Branch Basics generated only 2% of sales in 2023 from Social. 

Category Performance: Cleaning Supplies
August – December, 2023 US 

Branch Basics primarily sells Household Cleaning Supplies, which generated an estimated $774 million in online sales in the United States last year. In Q4 2023, BranchBasics.com accounted for 1.7% of all US e-commerce sales of Household Cleaning Supplies. While that’s still a small share, it’s up from 1.3% the year prior, a relative increase of 31%. 

Competitor Comparison
January 2023 – December 2023 US
branchbasics.com competitor revenue blueland.com mrsmeyers.com dirtylabs.com
There is a growing demand for eco-friendly cleaning products and Branch Basics is now one of the top brands, at least in terms of DTC sales. Compared to similar companies, Branch Basics had the second highest DTC revenue and the second highest YoY growth. Only DirtyLabs.com saw faster growth (332% versus Branch Basics’ 30%), however Dirty Labs generated only 2.9 million in US revenue last year, less than a third of Branch Basics. On other metics, Branch Basics also performs well. It has the highest conversion rate of any close competitors and the second highest AOV. 

The list doesn't end here

Grips has insights into 50,000 e-commerce sites and 60,000 brands across thousands of product categories big and small. Let us show your the inside secrets of your top competitors. Book a demo today.