What is the Grips e-commerce Benchmarking Tool?
Grips e-commerce Benchmarking is the health check for your online store which helps you to diagnose the state of your store’s sales performance and see where to improve. It provides the essential e-commerce benchmarks, including revenue, AOV, and conversion rates. With this information, you can take strategic actions towards sustainable growth with real-time visibility into the performance of your peers.
Here is a quick video introduction:
How does it work?
Grip’s e-commerce Benchmarking Tool is totally free to use. These are the steps you take to get started:
- Select peer companies: Define the exact e-commerce stores you want to compare. Grips covers >40k e-commerce stores, so you can find the more relevant stores to compare yourself against.
- Connect your store: Connect your Google Analytics account (both GA4 and any accounts still using UA are still accepted as well).
- Start benchmarking: See your store’s performance against your peers.
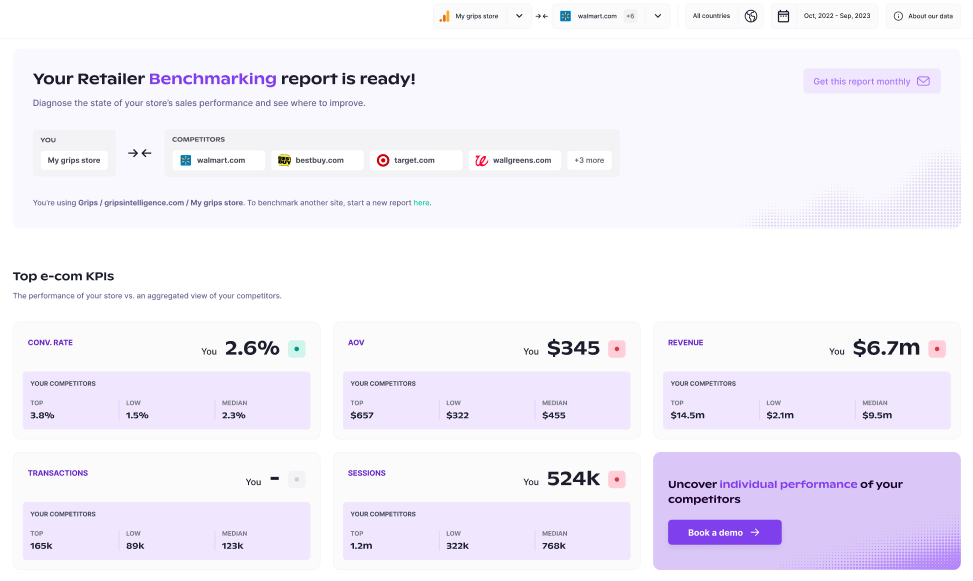
Once you’ve connected your store, you will see your store’s data against the competitors you selected. In this top part of the app, you can see the exact competitors you selected, the exact Google Analytics property you selected, and the most important KPIs
For each KPI card, we are showing your performance, and then the metrics for the highest, lowest and median competitor to give more context to the performance of your store.
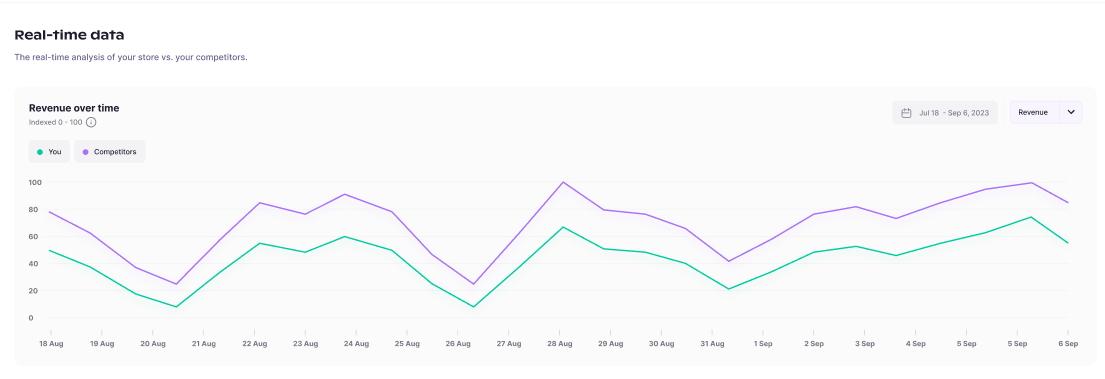
Next you can see several time series charts, which at exactly which moments your performance differed from your competitors. You are able to select any of the metrics on this chart. To make the comparison easier and to make the trends more recognizable, the app scales the values 0-100.
It is possible to see data with daily granularity that is updated daily as well as historical performance going back 1 year.
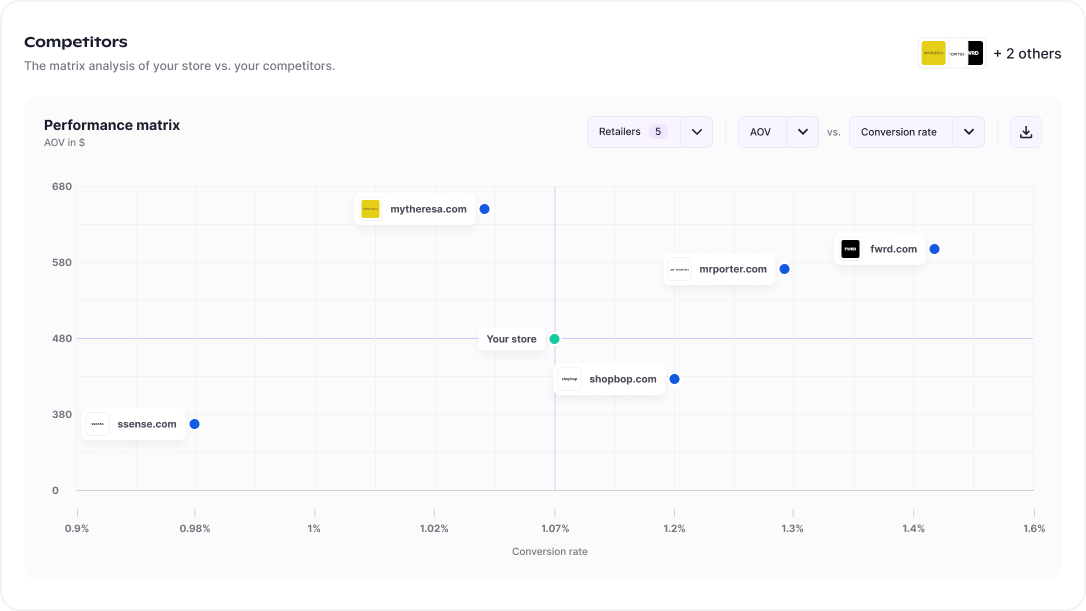
Additionally, on our Competitor matrix you can compare two metrics at once and understand how you compare to your competitors and quickly identify who are the top performers who you should emulate and who you are already beating.
What metrics do you have?
- Revenue: Revenue for the domain from online sales (in USD) for the selected period
- Transactions: Number of transactions for the domain for the selected period
- Sessions: Number of visits for the domain for the selected period
- Conversion rate: Number of sessions divided by transactions
- AOV: Average order value
How is this tool different from all other Benchmarking tools?
Grips e-commerce Benchmarking gives you a quick overview of the e-commerce metrics of your industry. These include Revenue, Average Order Value, and Conversion Rates – metrics you won’t get anywhere else. It will only take a few minutes to learn where you are doing good and where you need to take action as we put your data next to aggregated data of your competition.
Are the metrics calculated the same as in my Google Analytics account?
The metrics we are reporting are calculated in the same as the values in your Google Analytics account to make the comparisons accurate. With that in mind, the revenue metrics you see are excluding returns, subscriptions and any app sales. Read more in our knowledge base.
Do you have app data?
No
How often is your data updated?
For many of the retailers used in the benchmarks the data is updated daily or weekly, so a small subset the data is updated monthly.
How do you define a conversion and conversion rate?
A conversion is a purchase made on a retailers site, and conversion rate uses those purchases divided by sessions.