You’ll start your grips journey on the Grips Homepage
From here you can search for a retailer or a category. This guide will walk you through how to access retailer data and how you can use the retailer features to drive e-commerce sales for your business.
Start by searching for a domain.
You’ll then land on the retailer page.
Country picker
In the top right corner, you’ll find some report parameters that you can adjust to get the most relevant data for you.

The country filter can be used to look at domain performance for specific countries. Please note, not all domains operate globally. For example, shoppers can only purchase from US bestbuy.com.
Date picker
We have around 4 years of historical data for some domains. The analysis will return 3 months as a default however you can select your preference in this date picker.
Should you wish to compare your selected period to another time frame, simply change the ‘Compare to’ option to either previous period or previous year.
Previous period – date period prior to selected time frame
Previous year – date period year prior to selected time frame.
Please note: Not all retailers will have 4 years of historical data – we’ll show you in the platform when this is the case.
Overview
The overview section provides a summary of the domain’s performance for the selected country and time period. This allows you to size the entire domain and understand the transactional performance for your selected date range and country.

Performance over time
This section shows how the retailer has performed over the selected time period. By default it will show monthly sales performance in $ however you can change the chart to view how other metrics have performed over time using the dropdown above the chart.

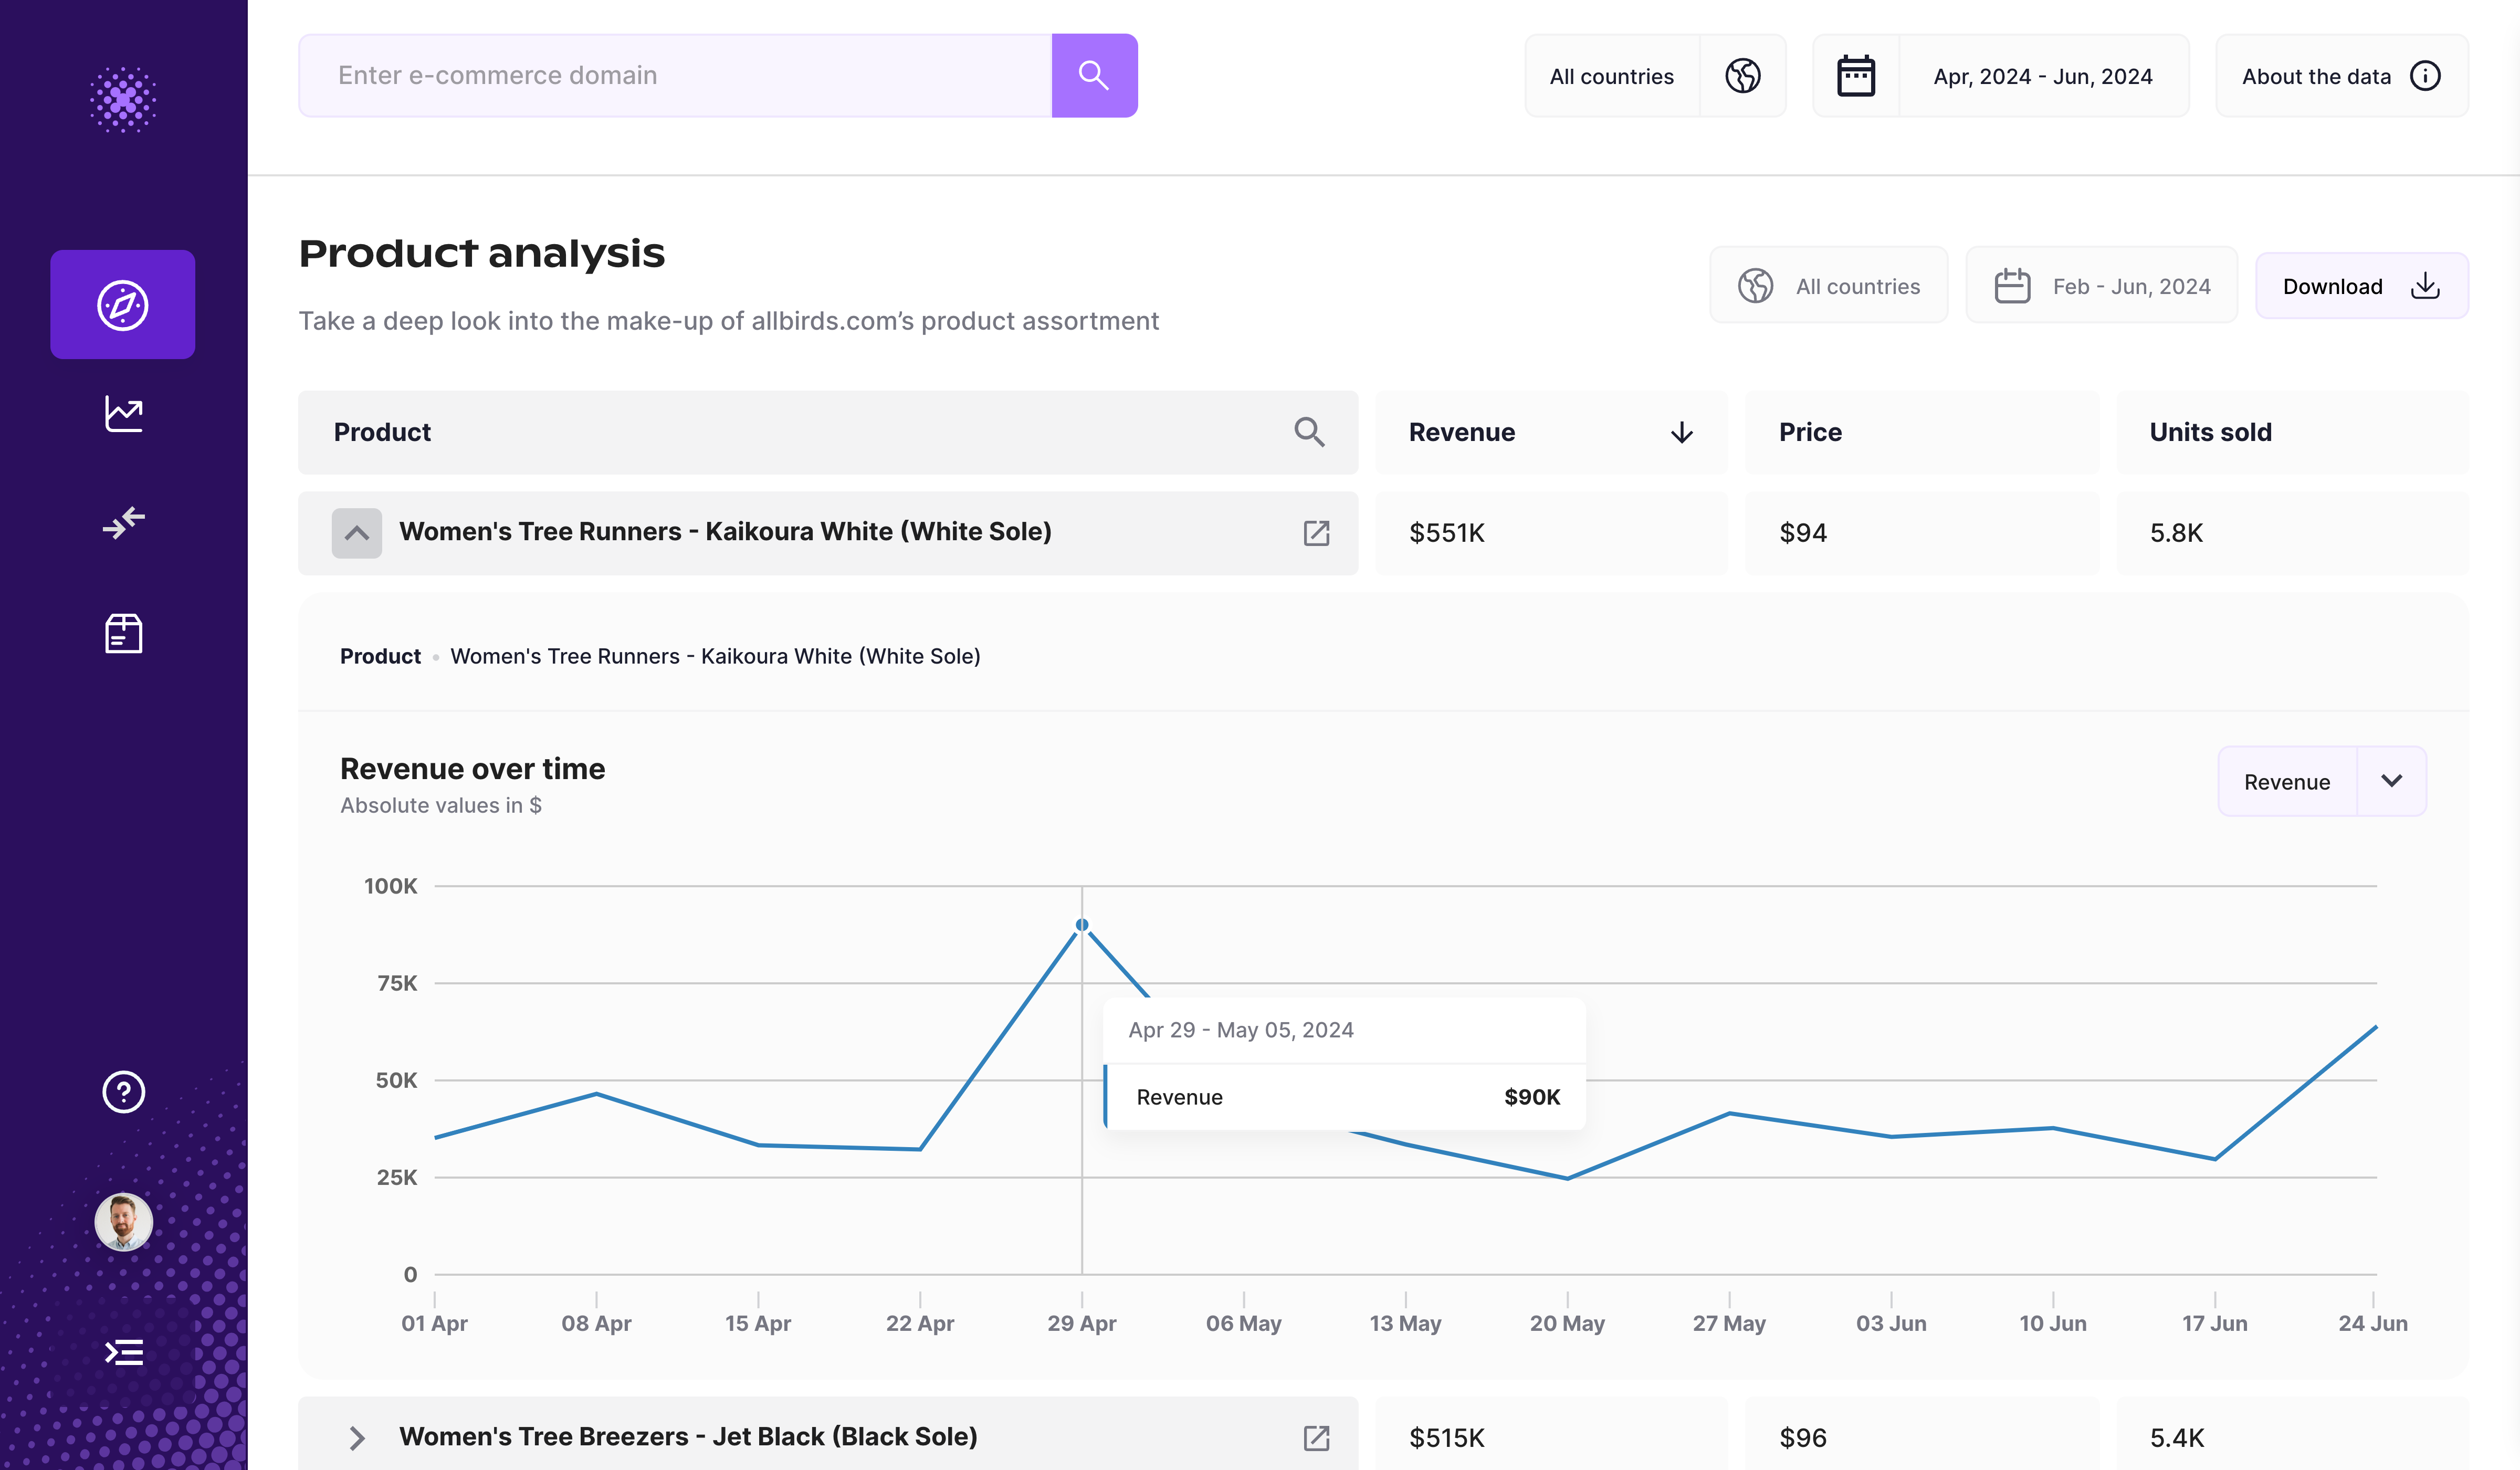
Product sales
This section displays the products sold by the retailer:
Competitors
The performance matrix shows domains considered competitors to your selected retailer. The matrix can be adjusted to plot two metrics of your choice so that you can understand how your selected retailer is performing and which retailers are over and under performing compared to it.

Ranking
Ranking shows what number the domain is ranked in the country and its global rank across countries /industries.
Top Competitors highlights the 5 domains that have high similarity to your selected retailers.

Channels
The channels section gives you the ability to identify the effectiveness of marketing channels to drive sales. Once you know how their competitive set is growing sales, you can uncover growth opportunities for yourself. What’s really interesting for you is that each channel can have its own implications for marketing tactics that drive sales:
1. Organic Search: users went to a search engine like Google or Bing and clicked an unpaid search result link to the domain. Google Analytics equivalent: Organic search.
2. Paid Search: users used a search engine and clicked on a paid ad to the domain. Google Analytics equivalent: Paid search.
3. Direct Traffic: users typed the domain’s URL directly into their browser, had the site bookmarked or from an otherwise unknown source. Google Analytics equivalent: Direct.
4. Social Traffic: users were on a social media platform like Facebook or LinkedIn and clicked a link to the domain. Google Analytics equivalent: Social Organic and Social Paid.
5. Referral/other: users clicked on a link to the domain from any other place excluding the channels defined above. Google Analytics equivalent: this includes any channel not included in the above channels.

Once you have this information, you can benchmark your own performance and see where you are over / under indexing in sales compared to their competitive set. From there, you can find the areas you need to focus your efforts and budgets on to beat your competitors.
For example, you could see your competitors have very low traffic and sales from the direct channel, but this channel has a high AOV and conversion rate. With this information, you could decide to emphasize more of your marketing efforts on SEO to capture this growth opportunity in the market.
Please note, our channel data starts from Aug 2022.
Google Ads Spend
In this segment you’ll be able to see the google ad spend by the retailer.

With this information, users can understand the amount of investments their competitors are making on google search and adjust their strategy accordingly.
Please note this includes non PLA, text ads only.
Devices
The ability to break down our hero metrics (sessions, transactions, revenue, AOV, conv. rate) by device.
Devices included and their definition:
- Desktop: User visited the site on a desktop or tablet device
- Mobile: User visited the site on a mobile device

The devices section gives you the ability to identify how devices are influencing sales for sites in your competitive set. With this information, you can understand how much traffic vs. sales are happening on different devices so you can make sure you optimize your overall marketing strategy accordingly.
You can benchmark their own performance. If you see that mobile devices are driving more sales for your competitors than they are, then you know you need to devote more resources to optimizing your mobile site.
You can also uncover market opportunities. By looking at your competitive set, you could discover that mobile is driving lots of traffic but their competitors are failing to convert that traffic. Then you can make the strategic decision to optimize your mobile site to capture sales from this mobile device audience.
Please note, our channel data starts from Aug 2022.
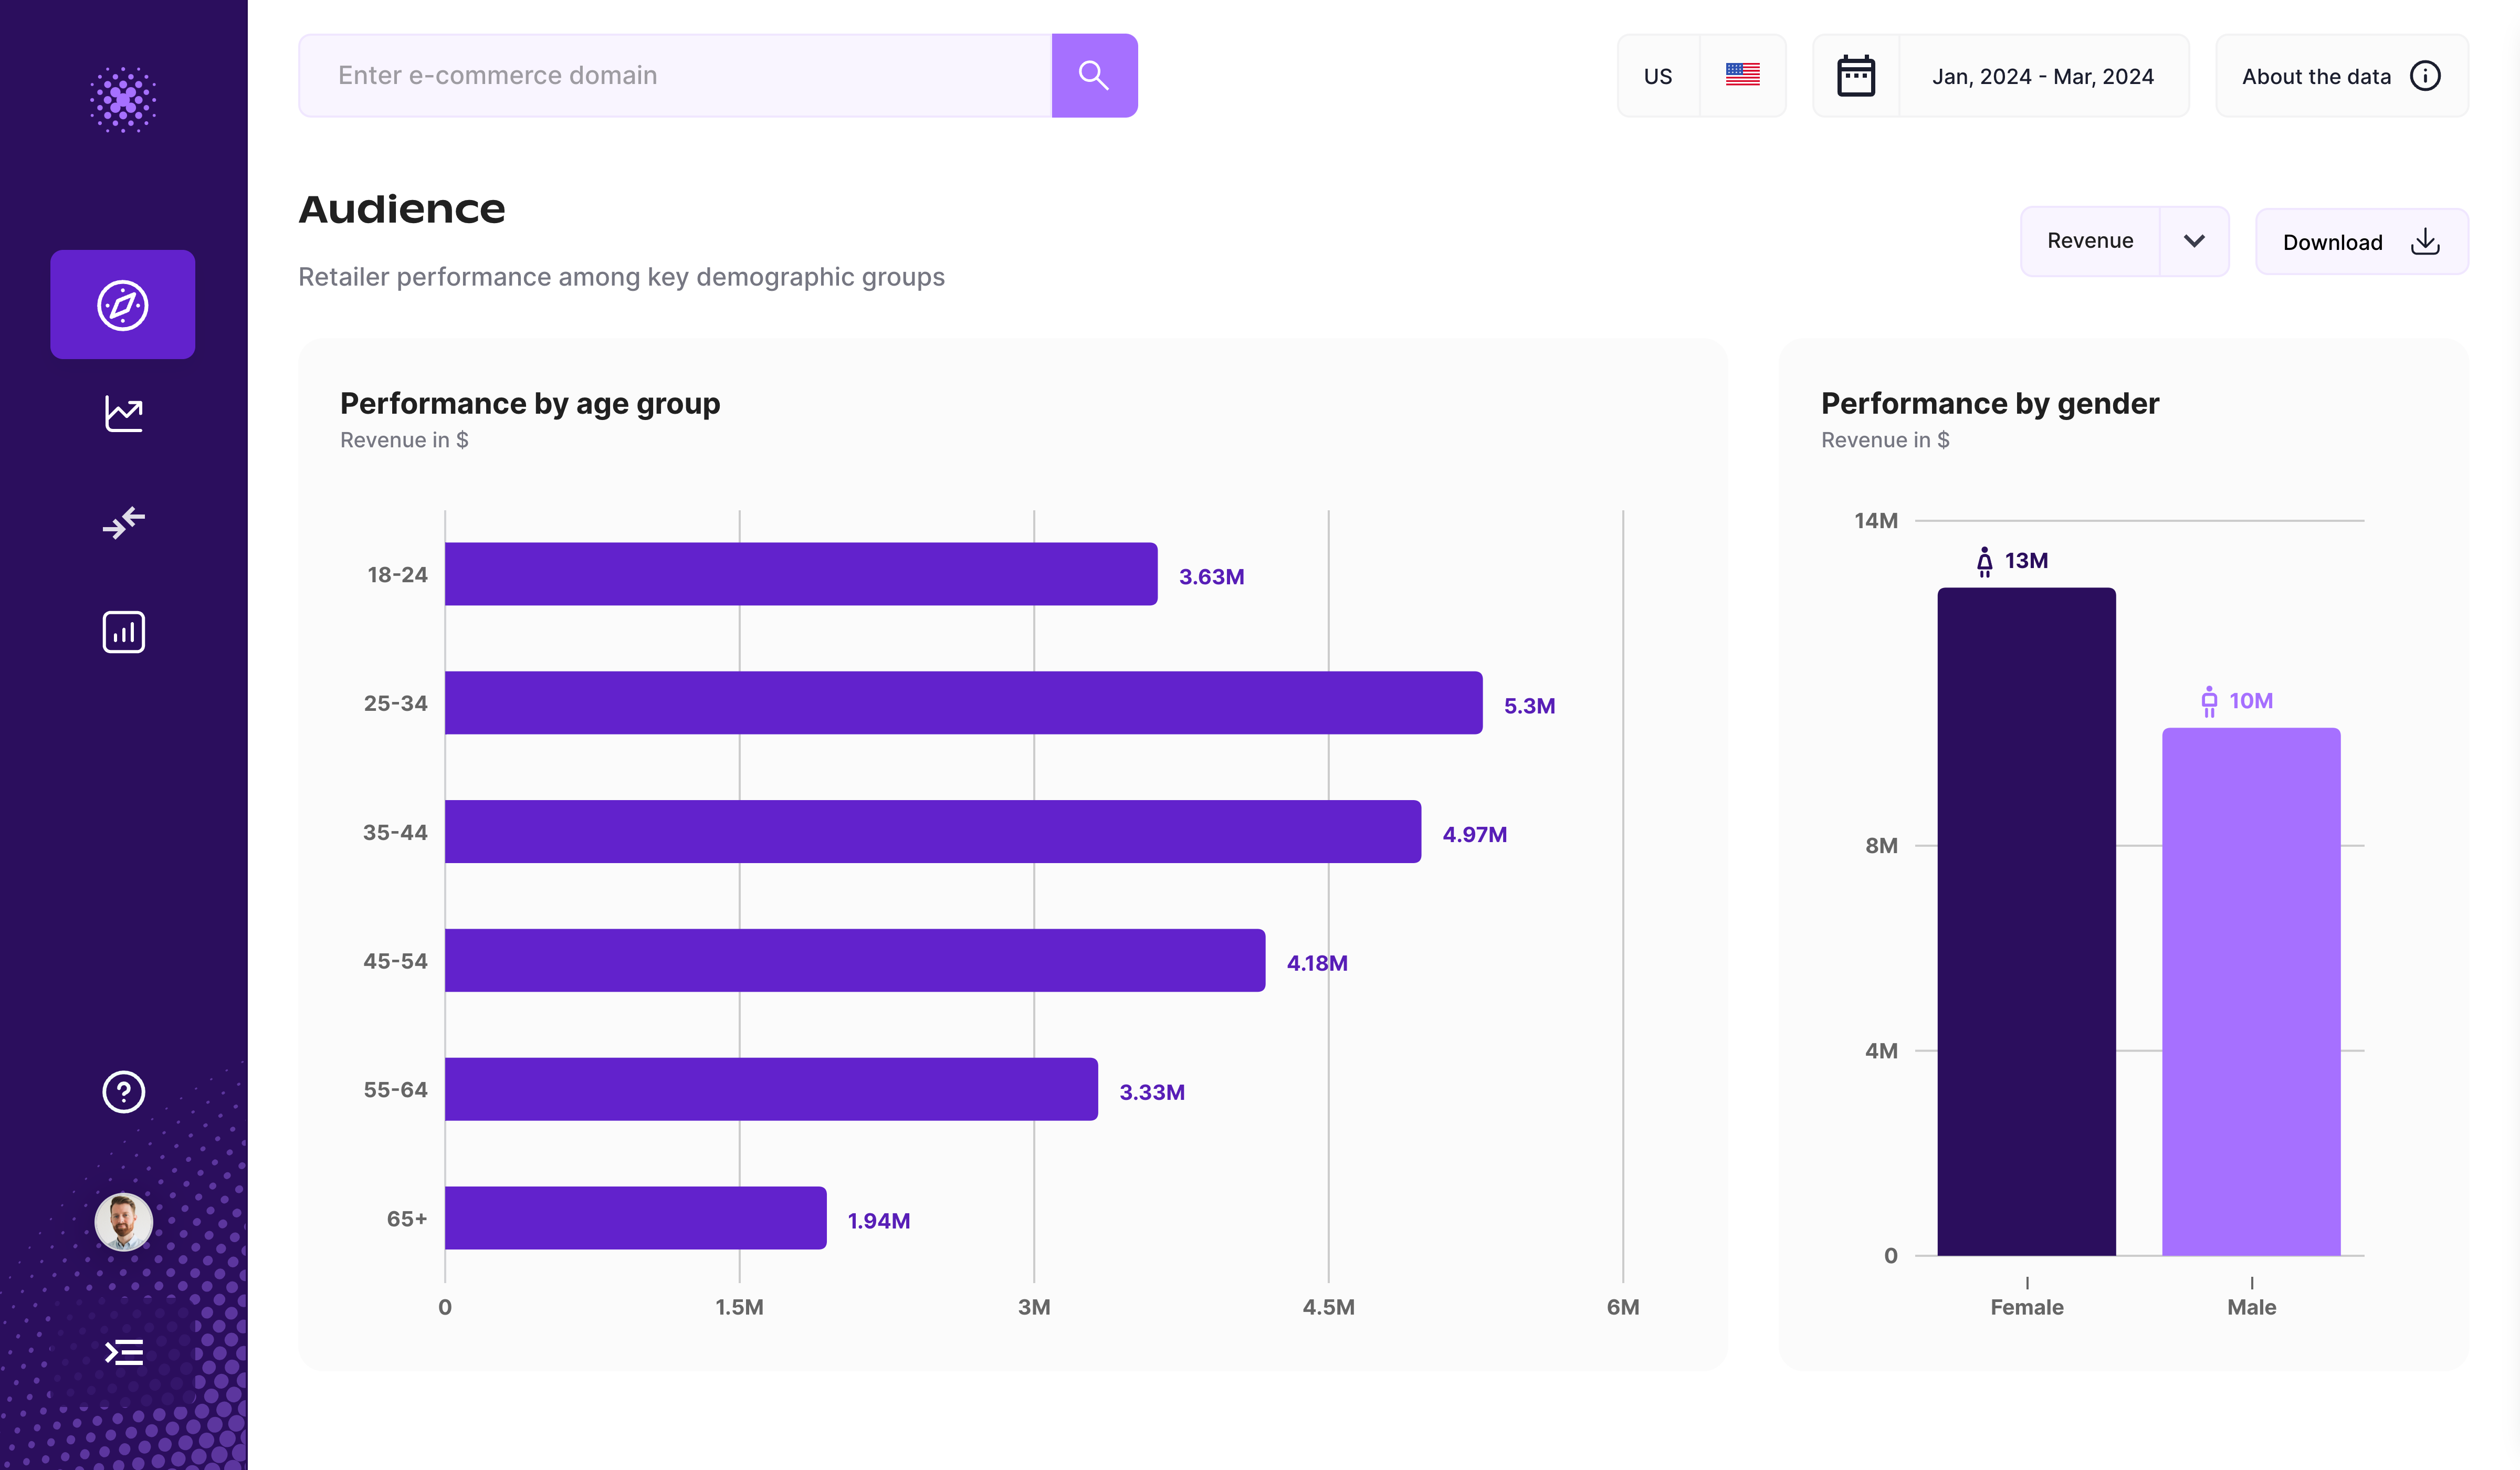
Audience
This section gives users the ability to break down our hero metrics (sessions, transactions, revenue, AOV, conv. rate) by age and gender.
With this information, you can better understand the target audience of a specific competitor e-commerce store and optimize marketing campaigns to cater to specific demographics. For example, if you notice that a certain age group has a higher conversion rate, AOV or revenue, you can tailor your messaging and promotions to appeal more to that demographic. Additionally, you can identify opportunities to expand your customer base by targeting new age groups or genders that have shown potential for growth.
Overall, this demographic data can help you make more informed decisions to improve the performance and success of your own e-commerce store.
Top countries
This section shows the top countries purchasing products from the domain.
If you are looking at a competitor retailer, this will help you to understand where the shoppers are based and allows you to make strategic decisions to based on demographics of shoppers.
