Grips Head to Head domain comparison is everything you’ve been looking for in an e-commerce competitive intelligence platform.
With this feature, it is possible to compare the performance of several domains side by side and generate a report.
Here is a quick video introduction:
Select your competitive set
To start building this report, first you must select the competitive set of domains you would like to compare. You can select an unlimited number of competitors. The charts in the app will display a maximum of 5 domains at one time. All domains that you select in your competitive set will be available, you just need to decide which 5 you’d like to see. Additionally, all of the domains will be available in the data download.

Market size, share and growth
This market size section is a great summary of this custom market. Here we can answer the first primary questions:
- How large is my custom market?
- Is it growing?

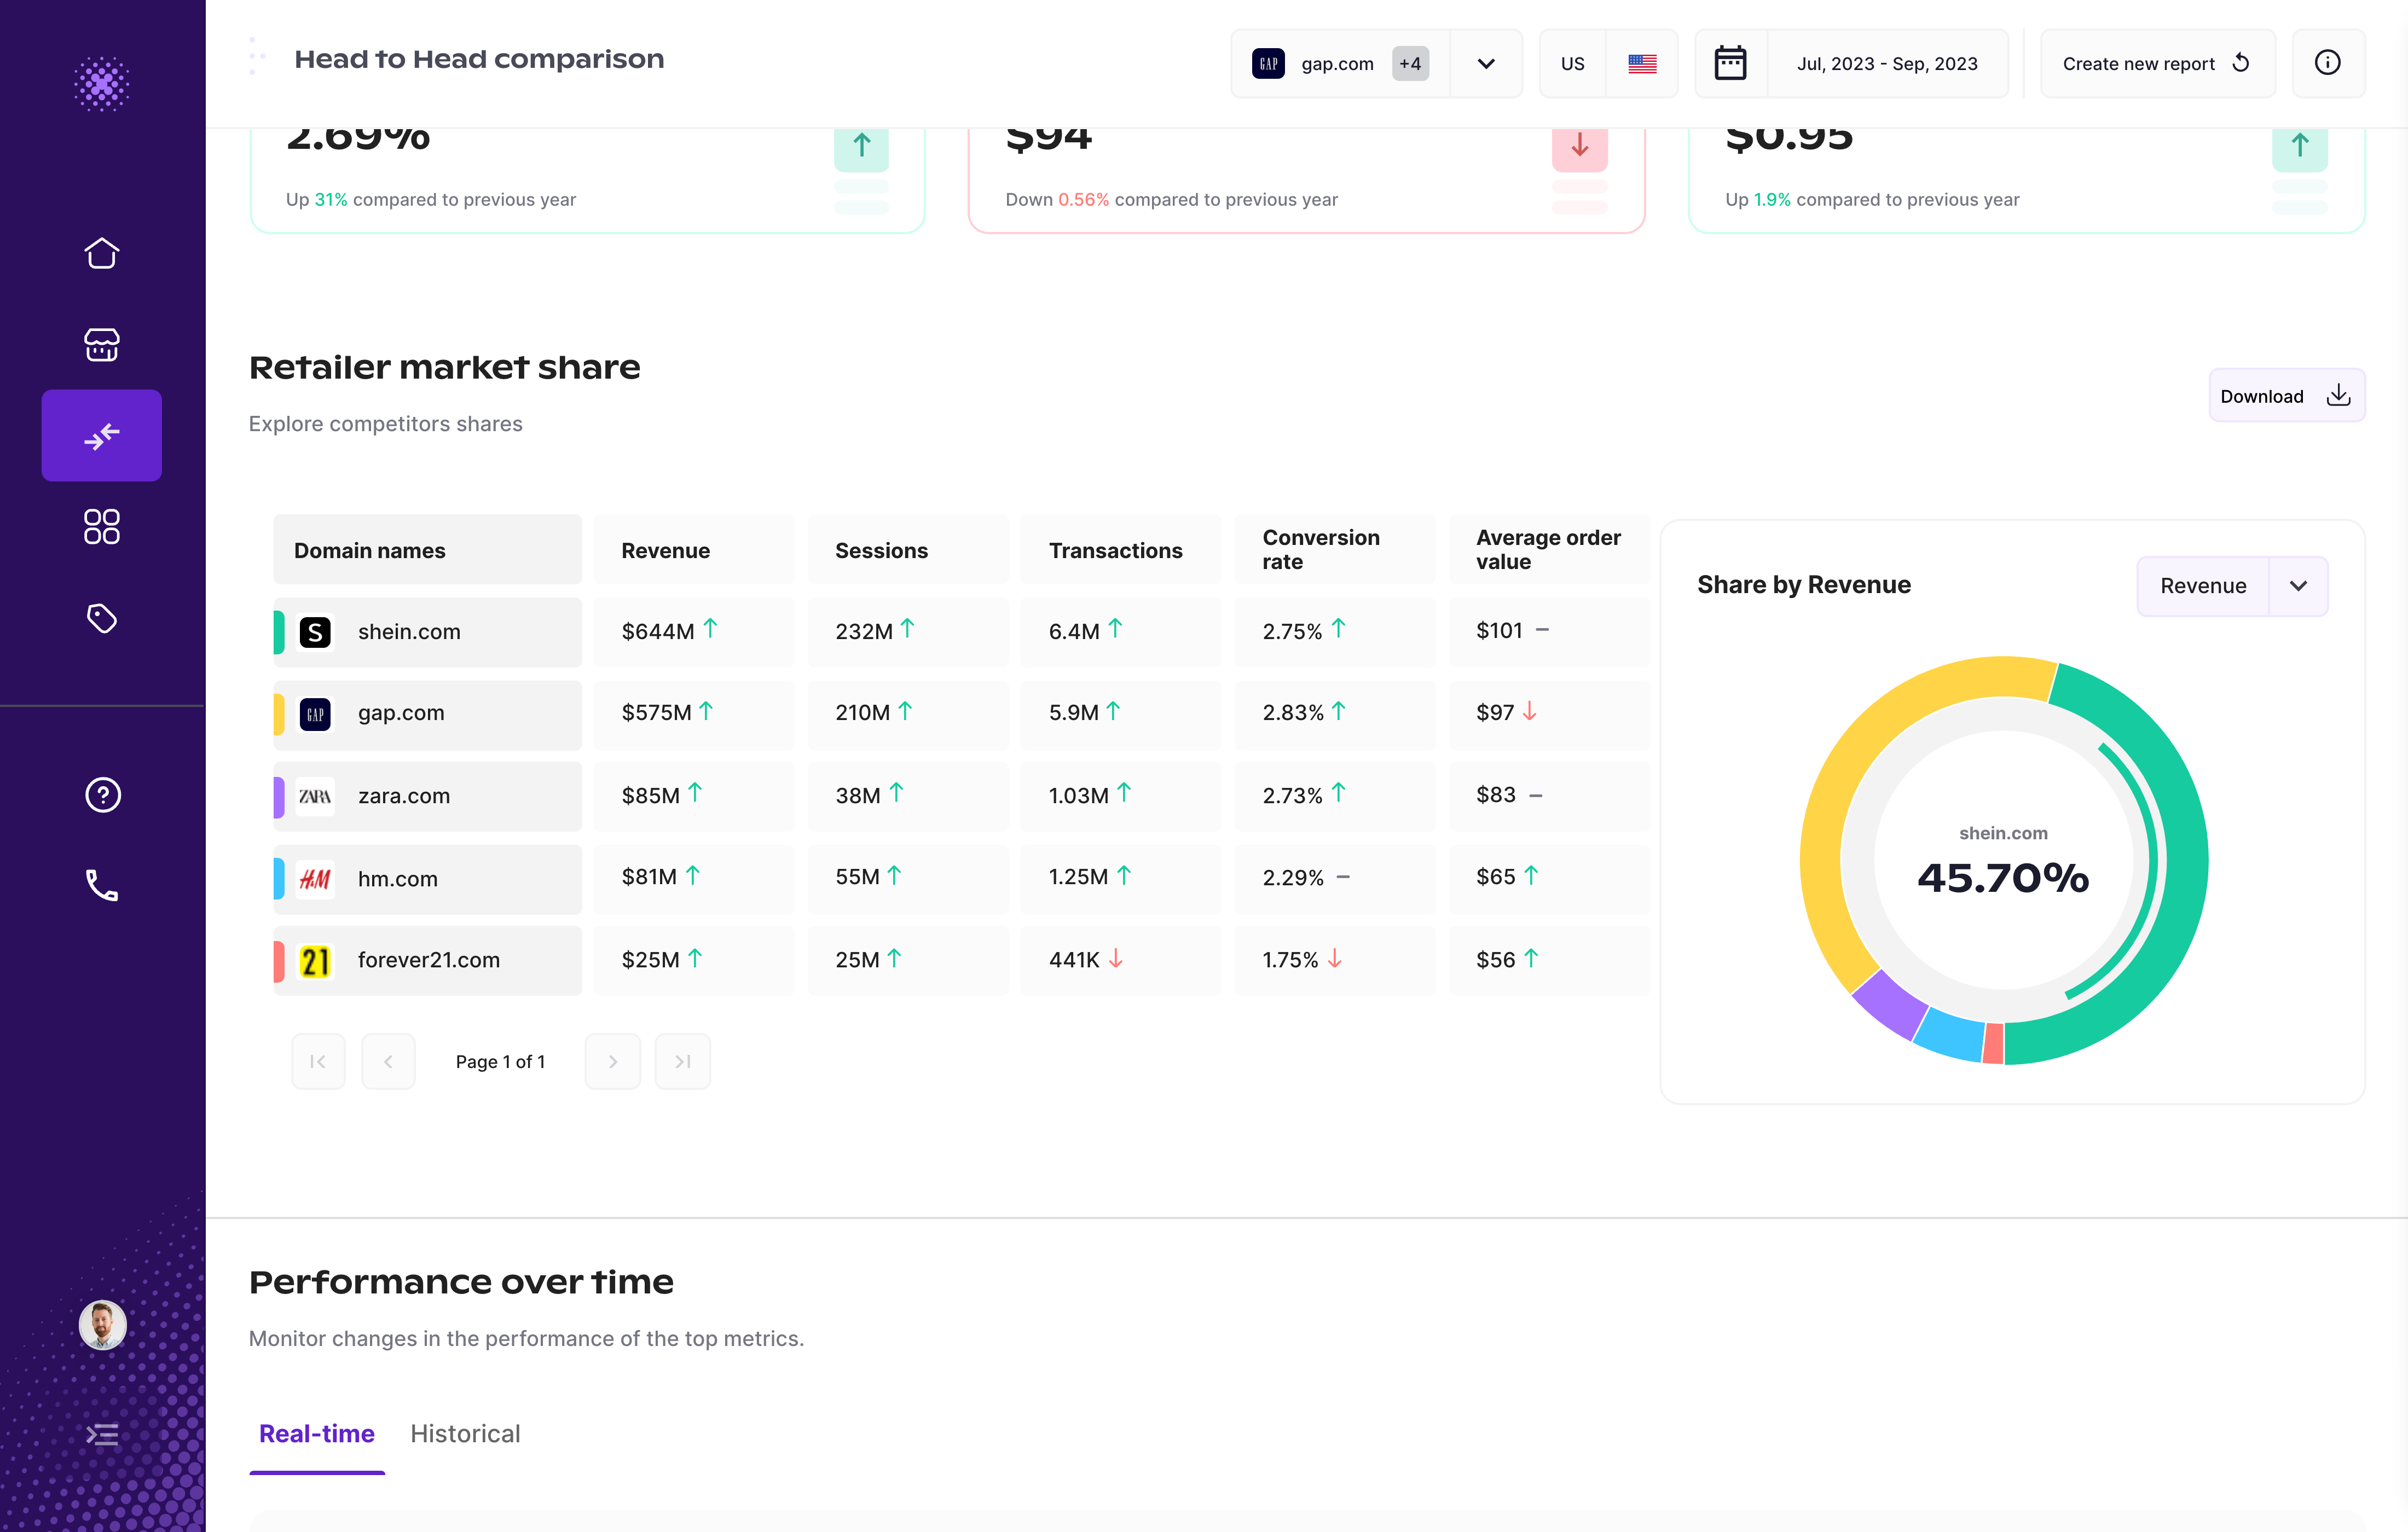
In the market share section can now see the domains you selected compared side by side. The donut chart will display shares based on the entire competitive set, not just the 5 shown in the table. It is possible to adjust the domains seen in the table.
Additionally, the small arrow next to each value in the table is comparing this value to a previous period, so you can better understand the growth trajectory of the metric. To control exactly what periods you are comparing, open the date picker and define this.
Here we can answer the following questions:
- What is the market share of a single domain?
- How does a single domain benchmark against the competitive set for important KPIs like AOV and conversion rate?
Grips’ daily data enables promotion and new product release monitoring, and more, where you can keep an eye on new product or service launches by competitors and assess the impact these launches have on market share and growth in the spikes and dips.

Competitive landscape
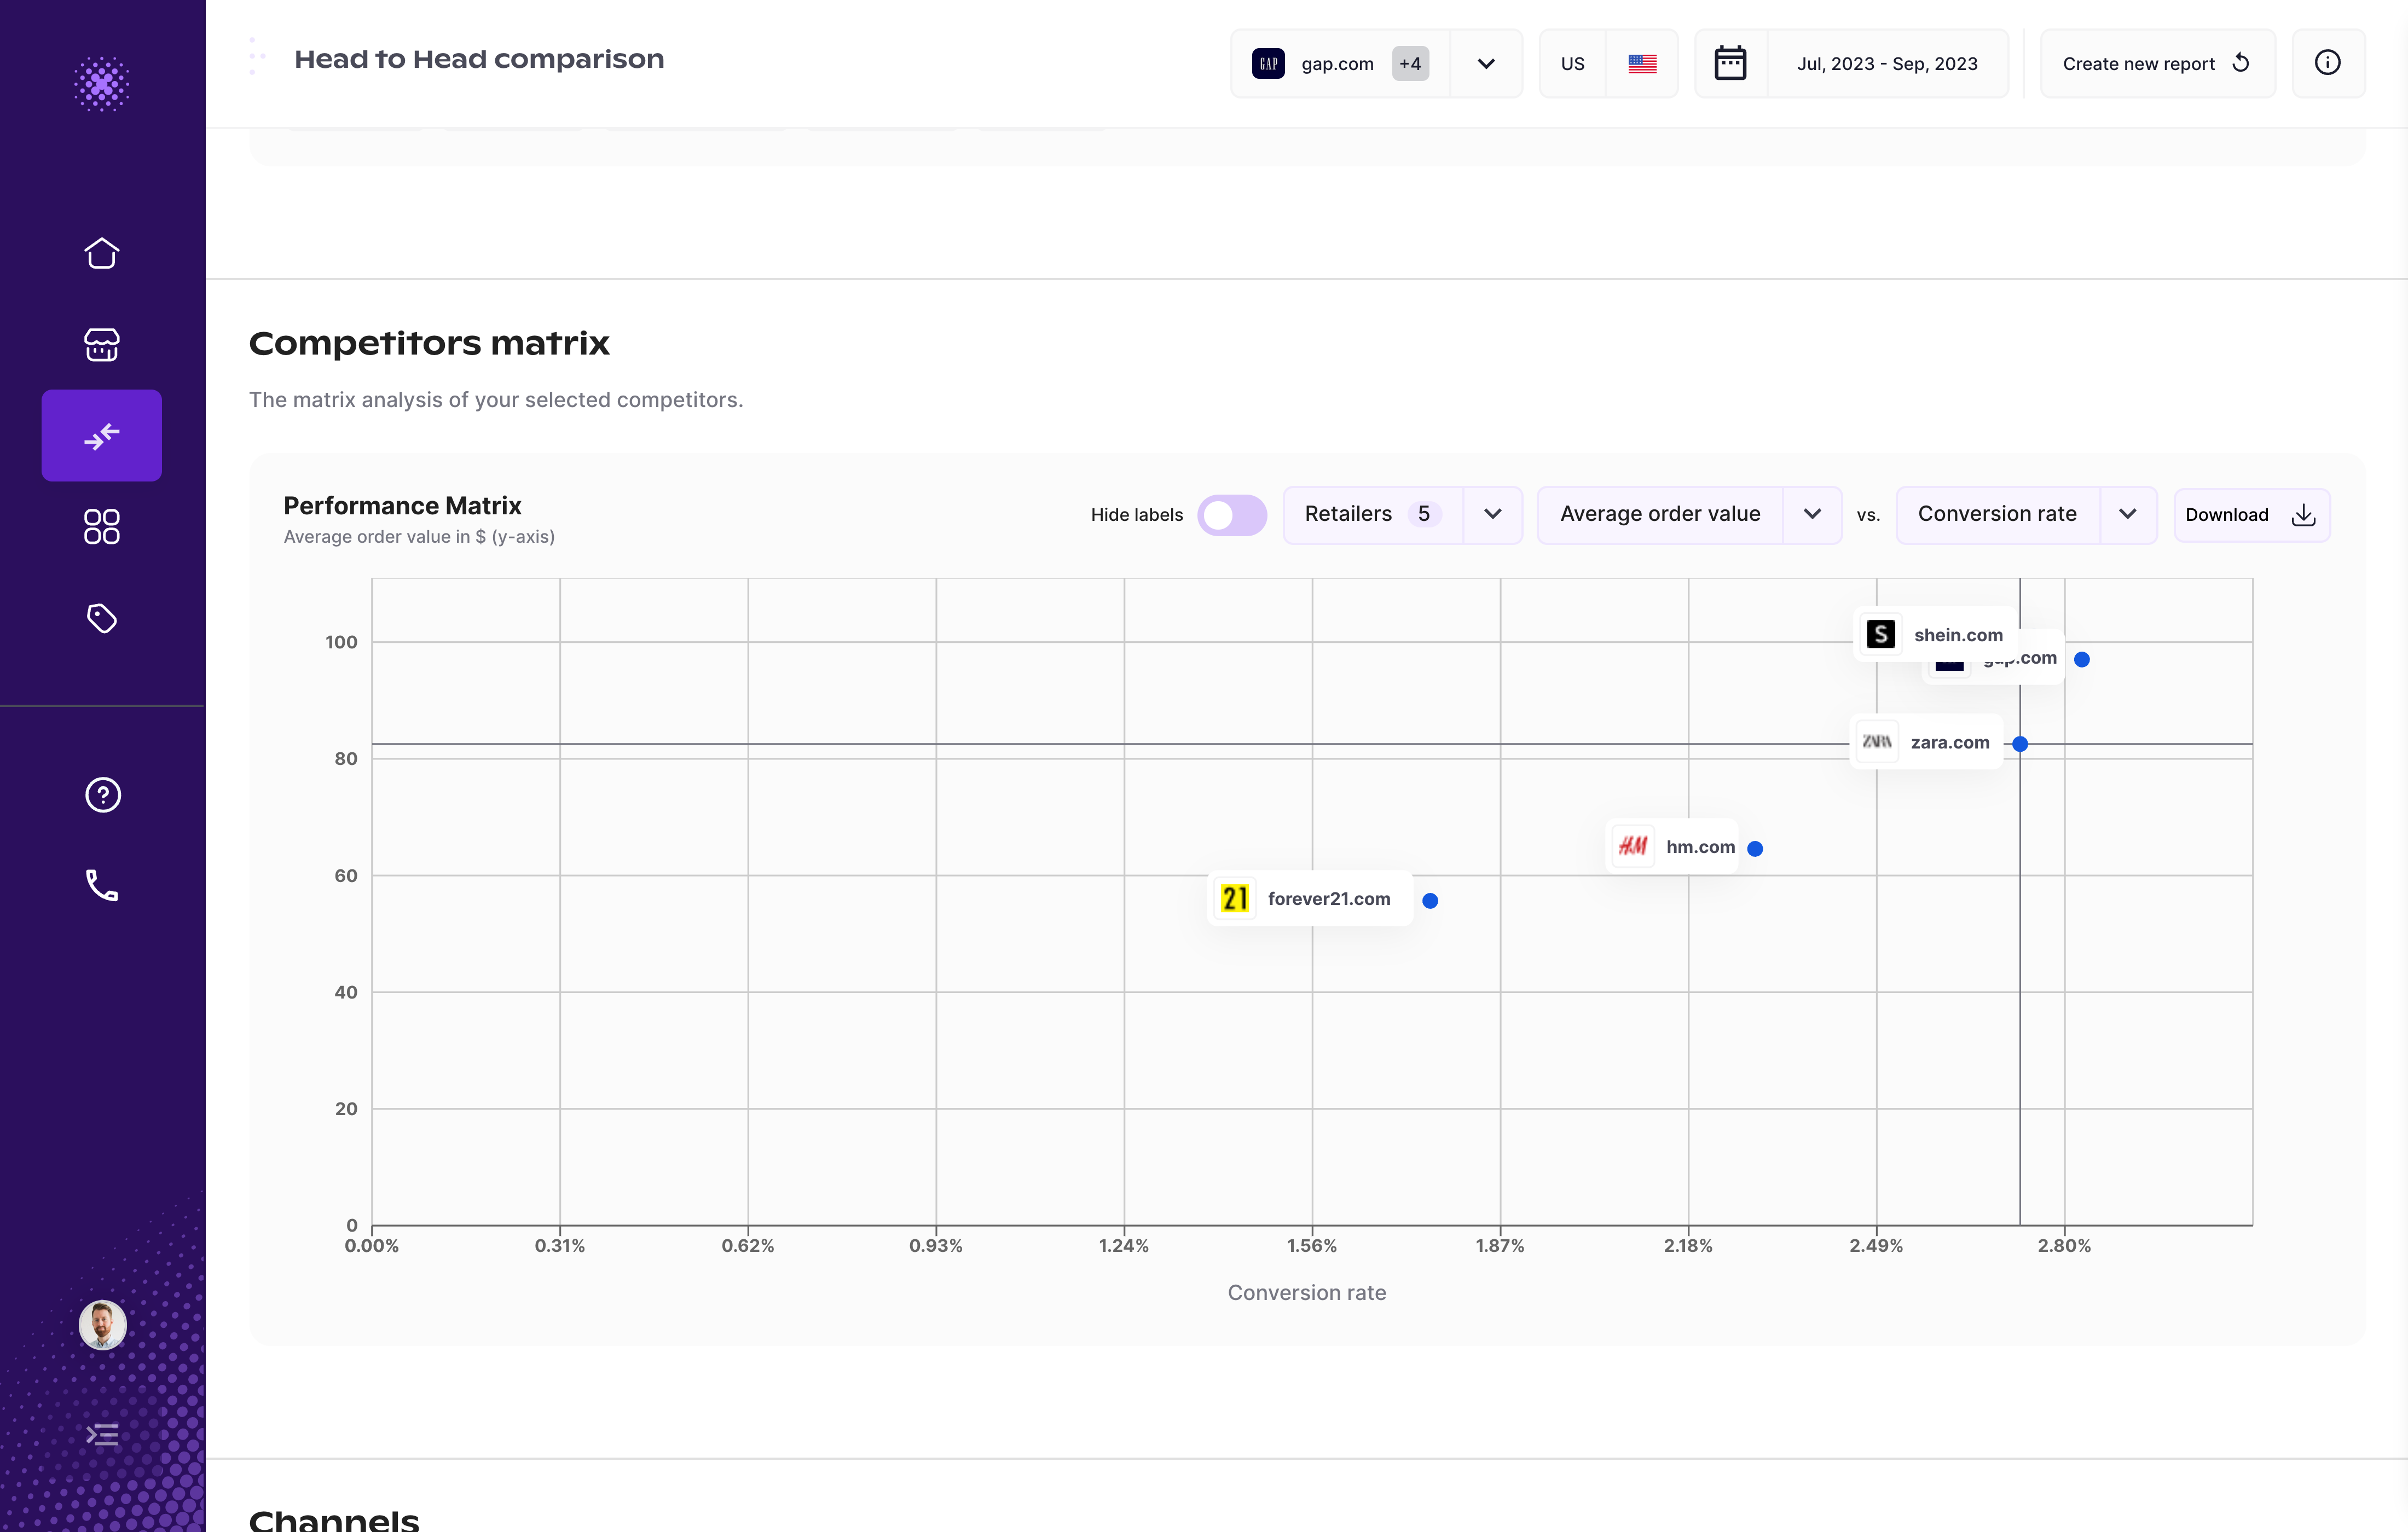
To really give more context into the performance of each domain, you can also view the competitive set plotted on a matrix where you can select two metrics to compare. Those competitors in the upper right corner are the top performers while those in the bottom left are the laggards.
Channel performance benchmarking
The channels section gives users the ability to identify the effectiveness of marketing channels to drive sales. Once users know how their competitive set is growing sales, they can uncover growth opportunities for themselves.
Once users have this information, they can benchmark their own performance and see where they are over / under indexing in sales compared to their competitive set. From there, they can find the areas they need to focus their efforts and budgets on to beat their competitors.
For example, they could see their competitors have very low traffic and sales from the organic channel, but this channel has a high AOV and conversion rate, which could be an opportunity. With this information, they could decide to emphasize more of their marketing efforts on SEO to capture this growth opportunity in the market.

Device performance benchmarking
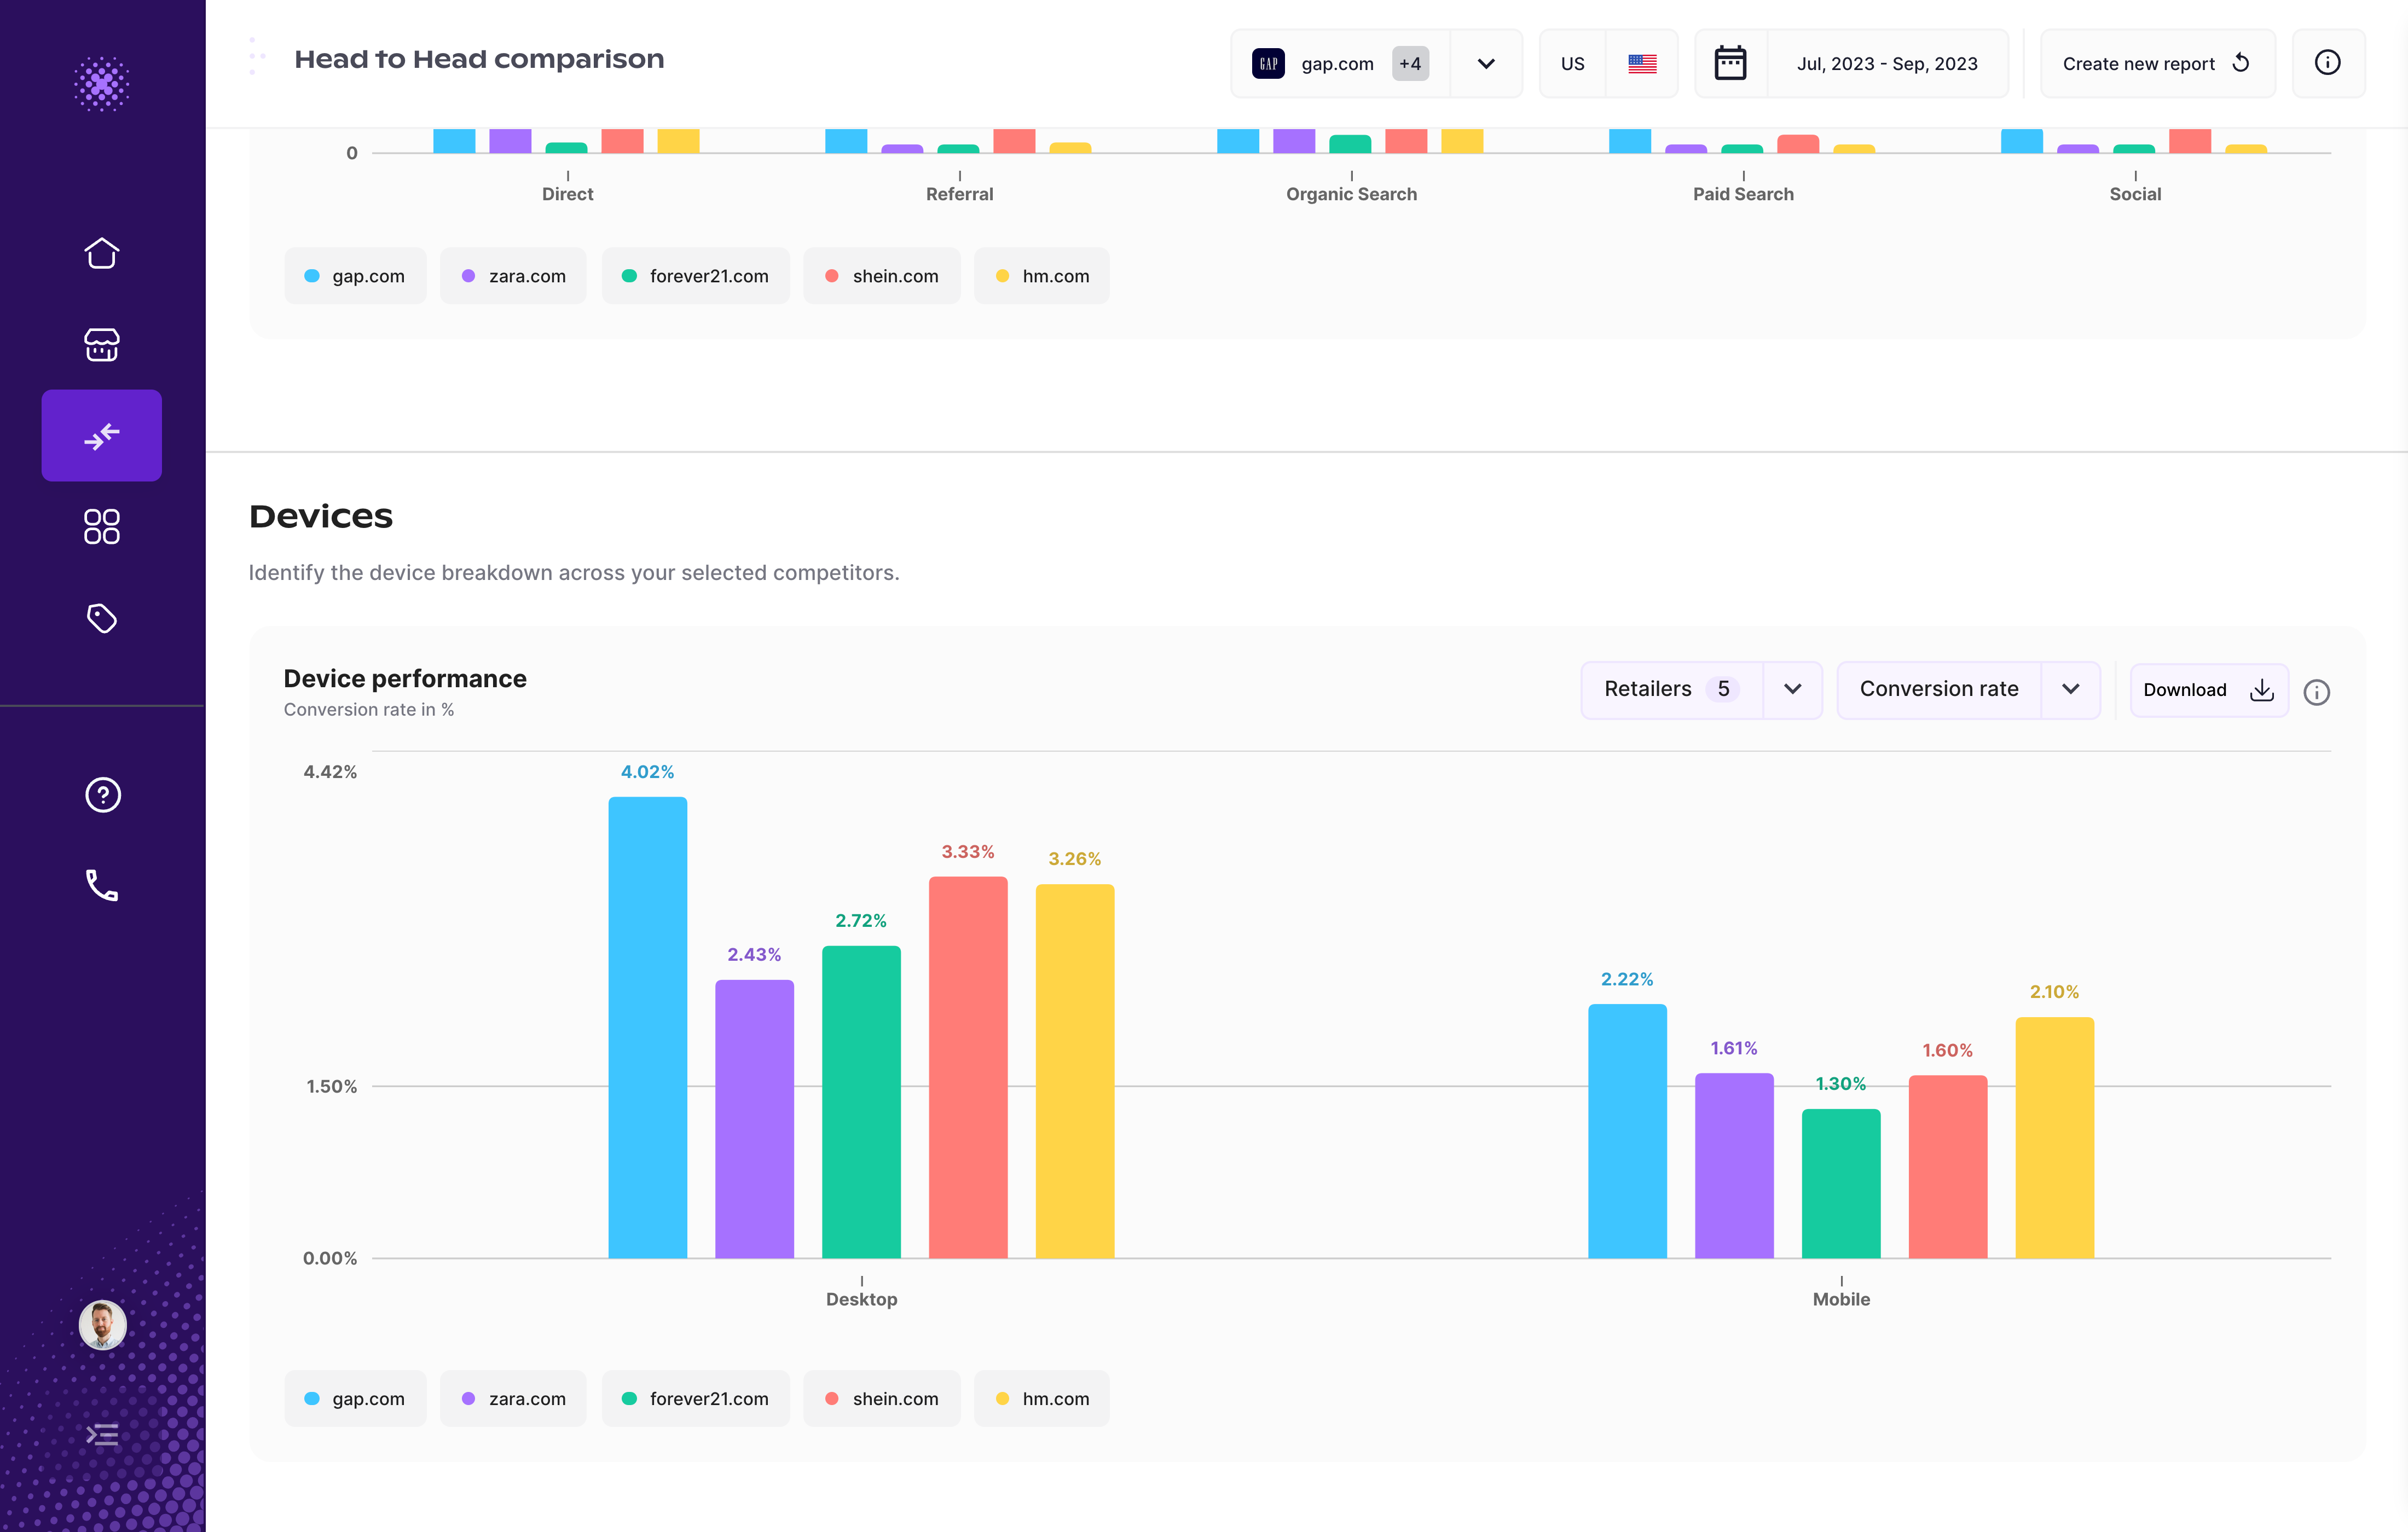
The devices section gives users the ability to identify how devices are influencing sales for sites in their competitive set. With this information, users can understand how much traffic vs. sales are happening on different devices so they can make sure they optimize their overall marketing strategy accordingly. Quick note: Grips includes just mobile web, no apps.
Audience performance benchmarking
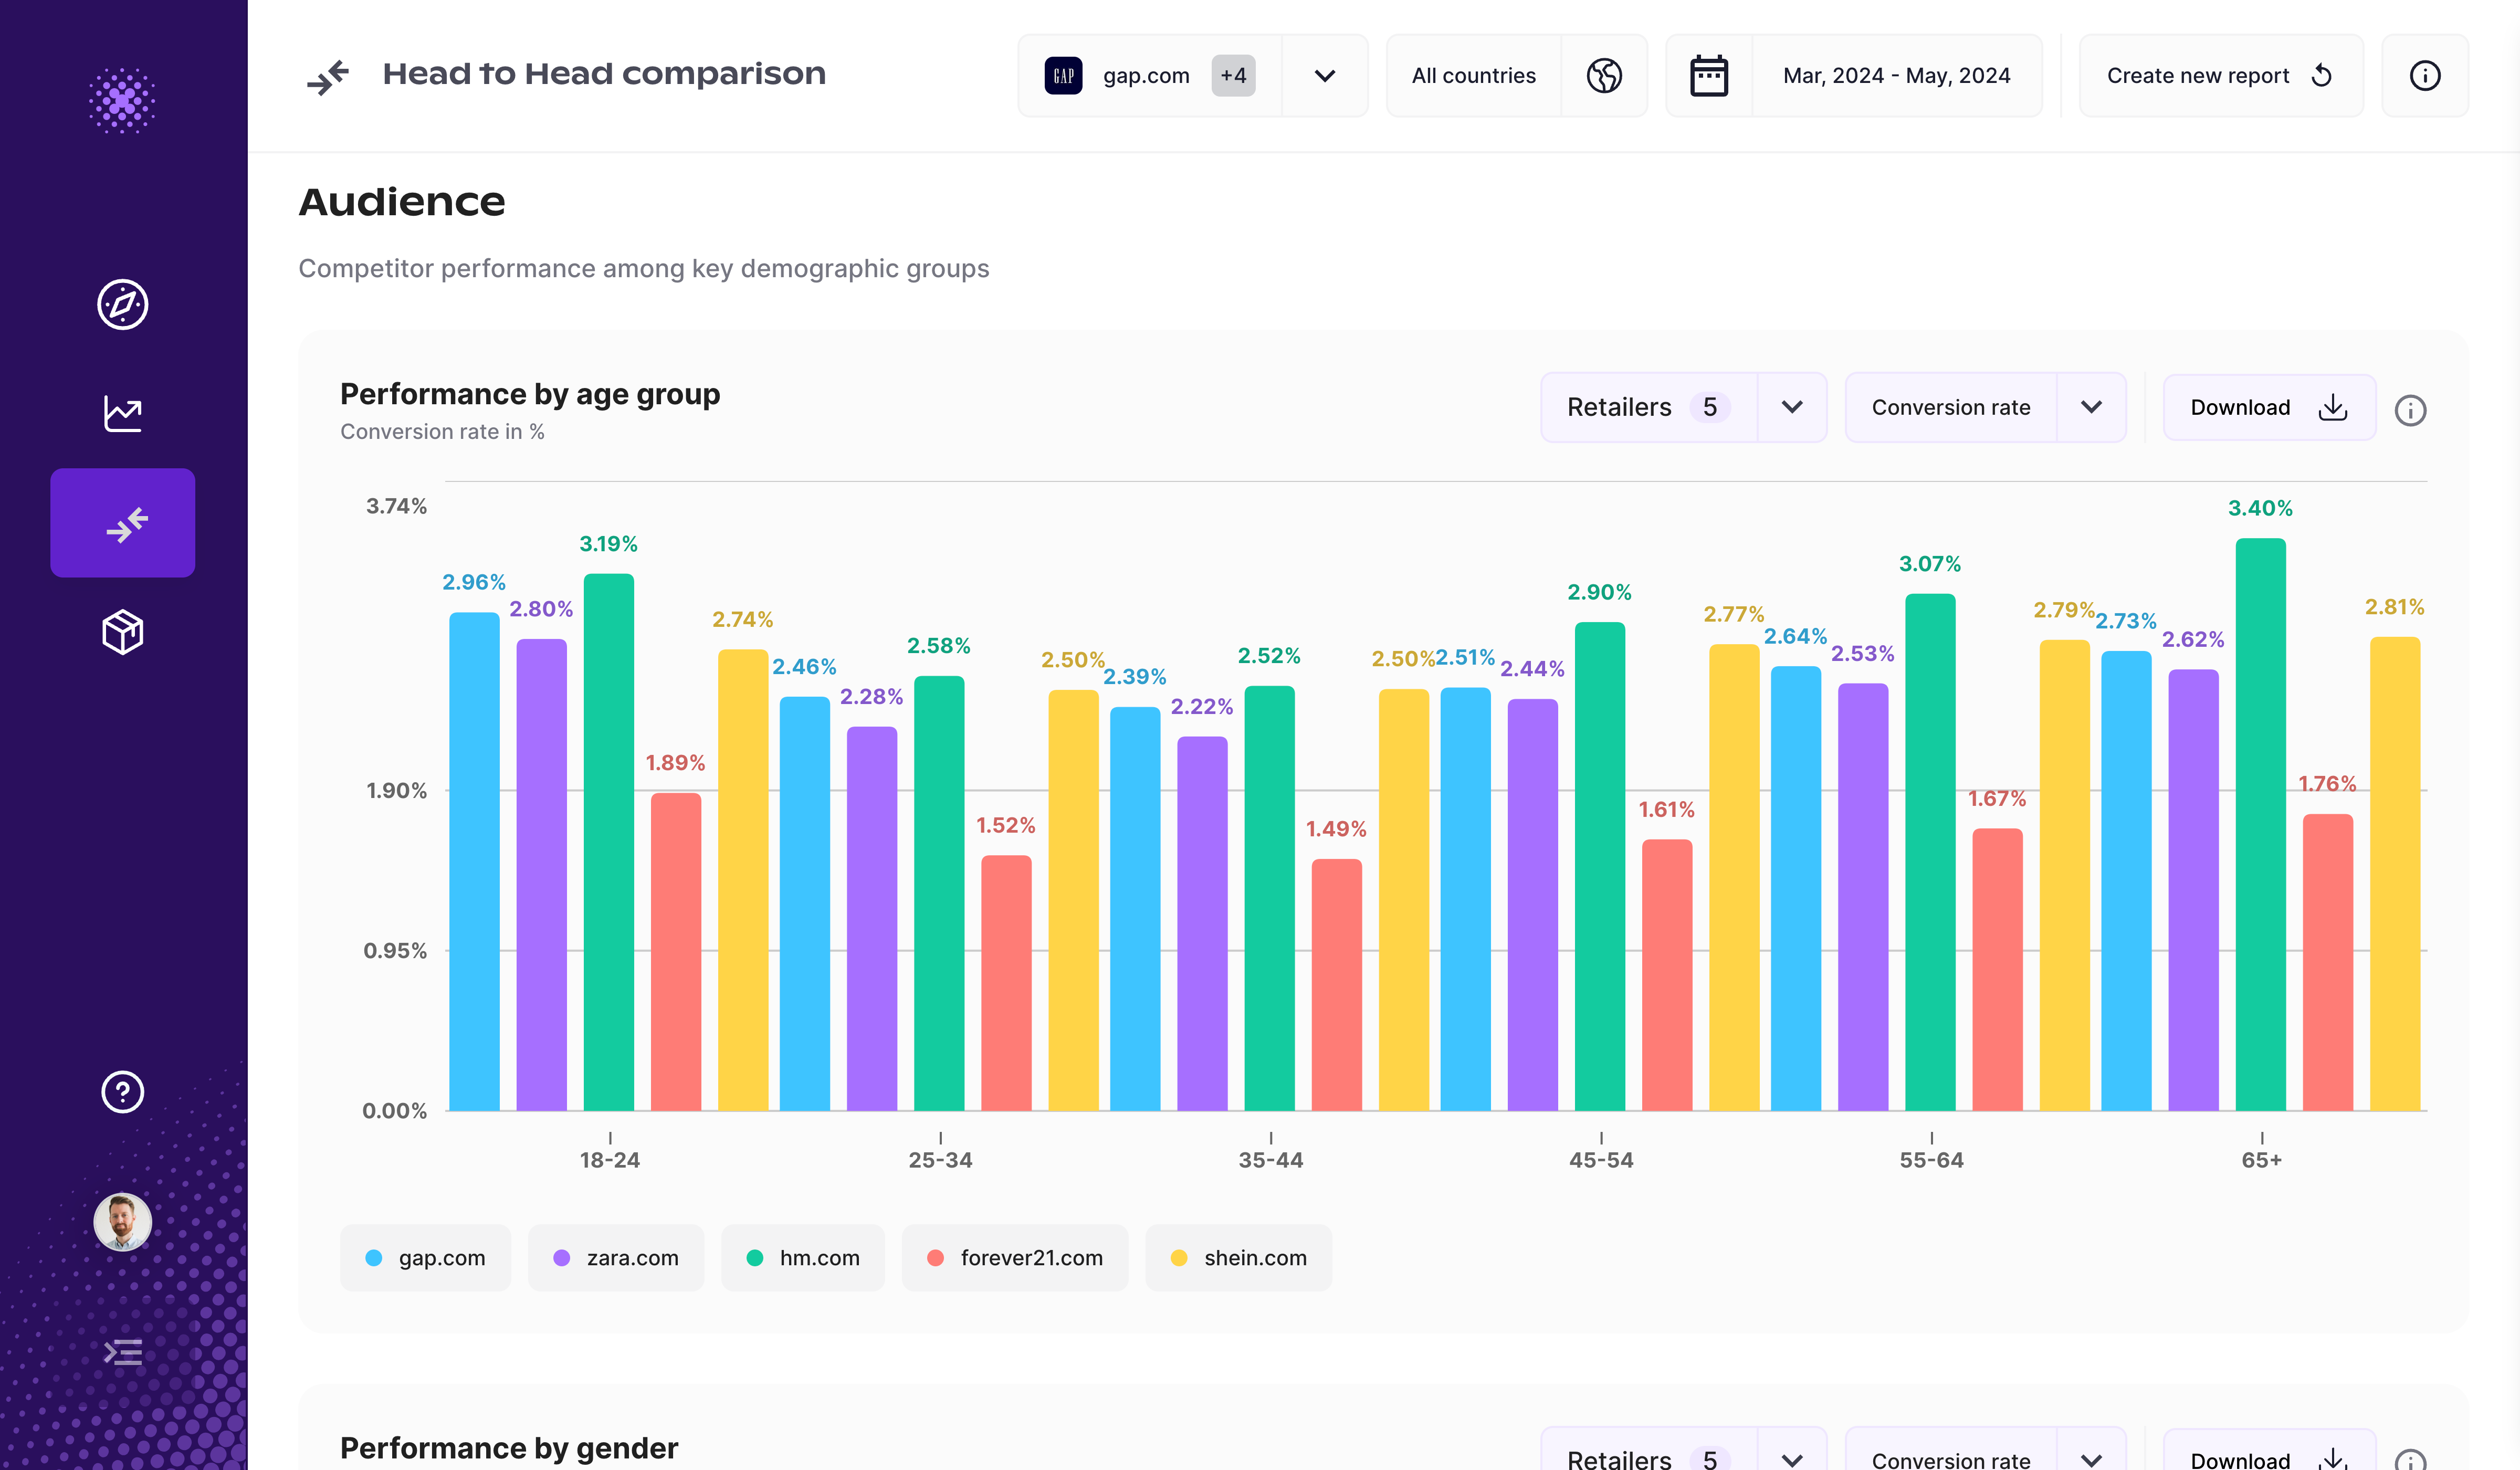
The Audience section gives users insights into how buyers from different ages and genders are influencing sales for sites in their competitive set. With this information, users can understand which audience to focus product and marketing efforts on. The age and gender dimensions are available for all of our core metrics seen in all other sections. For example, here we can see the conversion rate by age group:
Report saving
In the Grips platform, all head to head reports are automatically saved in your account so that you can easily access them in the future. You can can create an unlimited number of reports.