The Grips Product research feature gives you the ability to look at a domain and understand how each its products are performing, by revenue, units sold, price and much more.
With this feature it is possible to answer the following questions:
- Which products are selling the most on my competitors?
- When are my competitors launching new products? Are these launches successful?
- For a given brand being sold by a retailer, which products are selling the best/worst?
- For a given product category being sold by a retailer, which products are selling the best/worst?
- How are pricing changes influencing sales?
and more…
To dig deeper into how to leverage this tool to answer those questions and more, this article consists of two parts:
Part 1: a guide that demonstrates how to set up a report
Part 2: the intended use cases and how you can achieve them with the report
Part 1: Using the Product research module
Configure the report
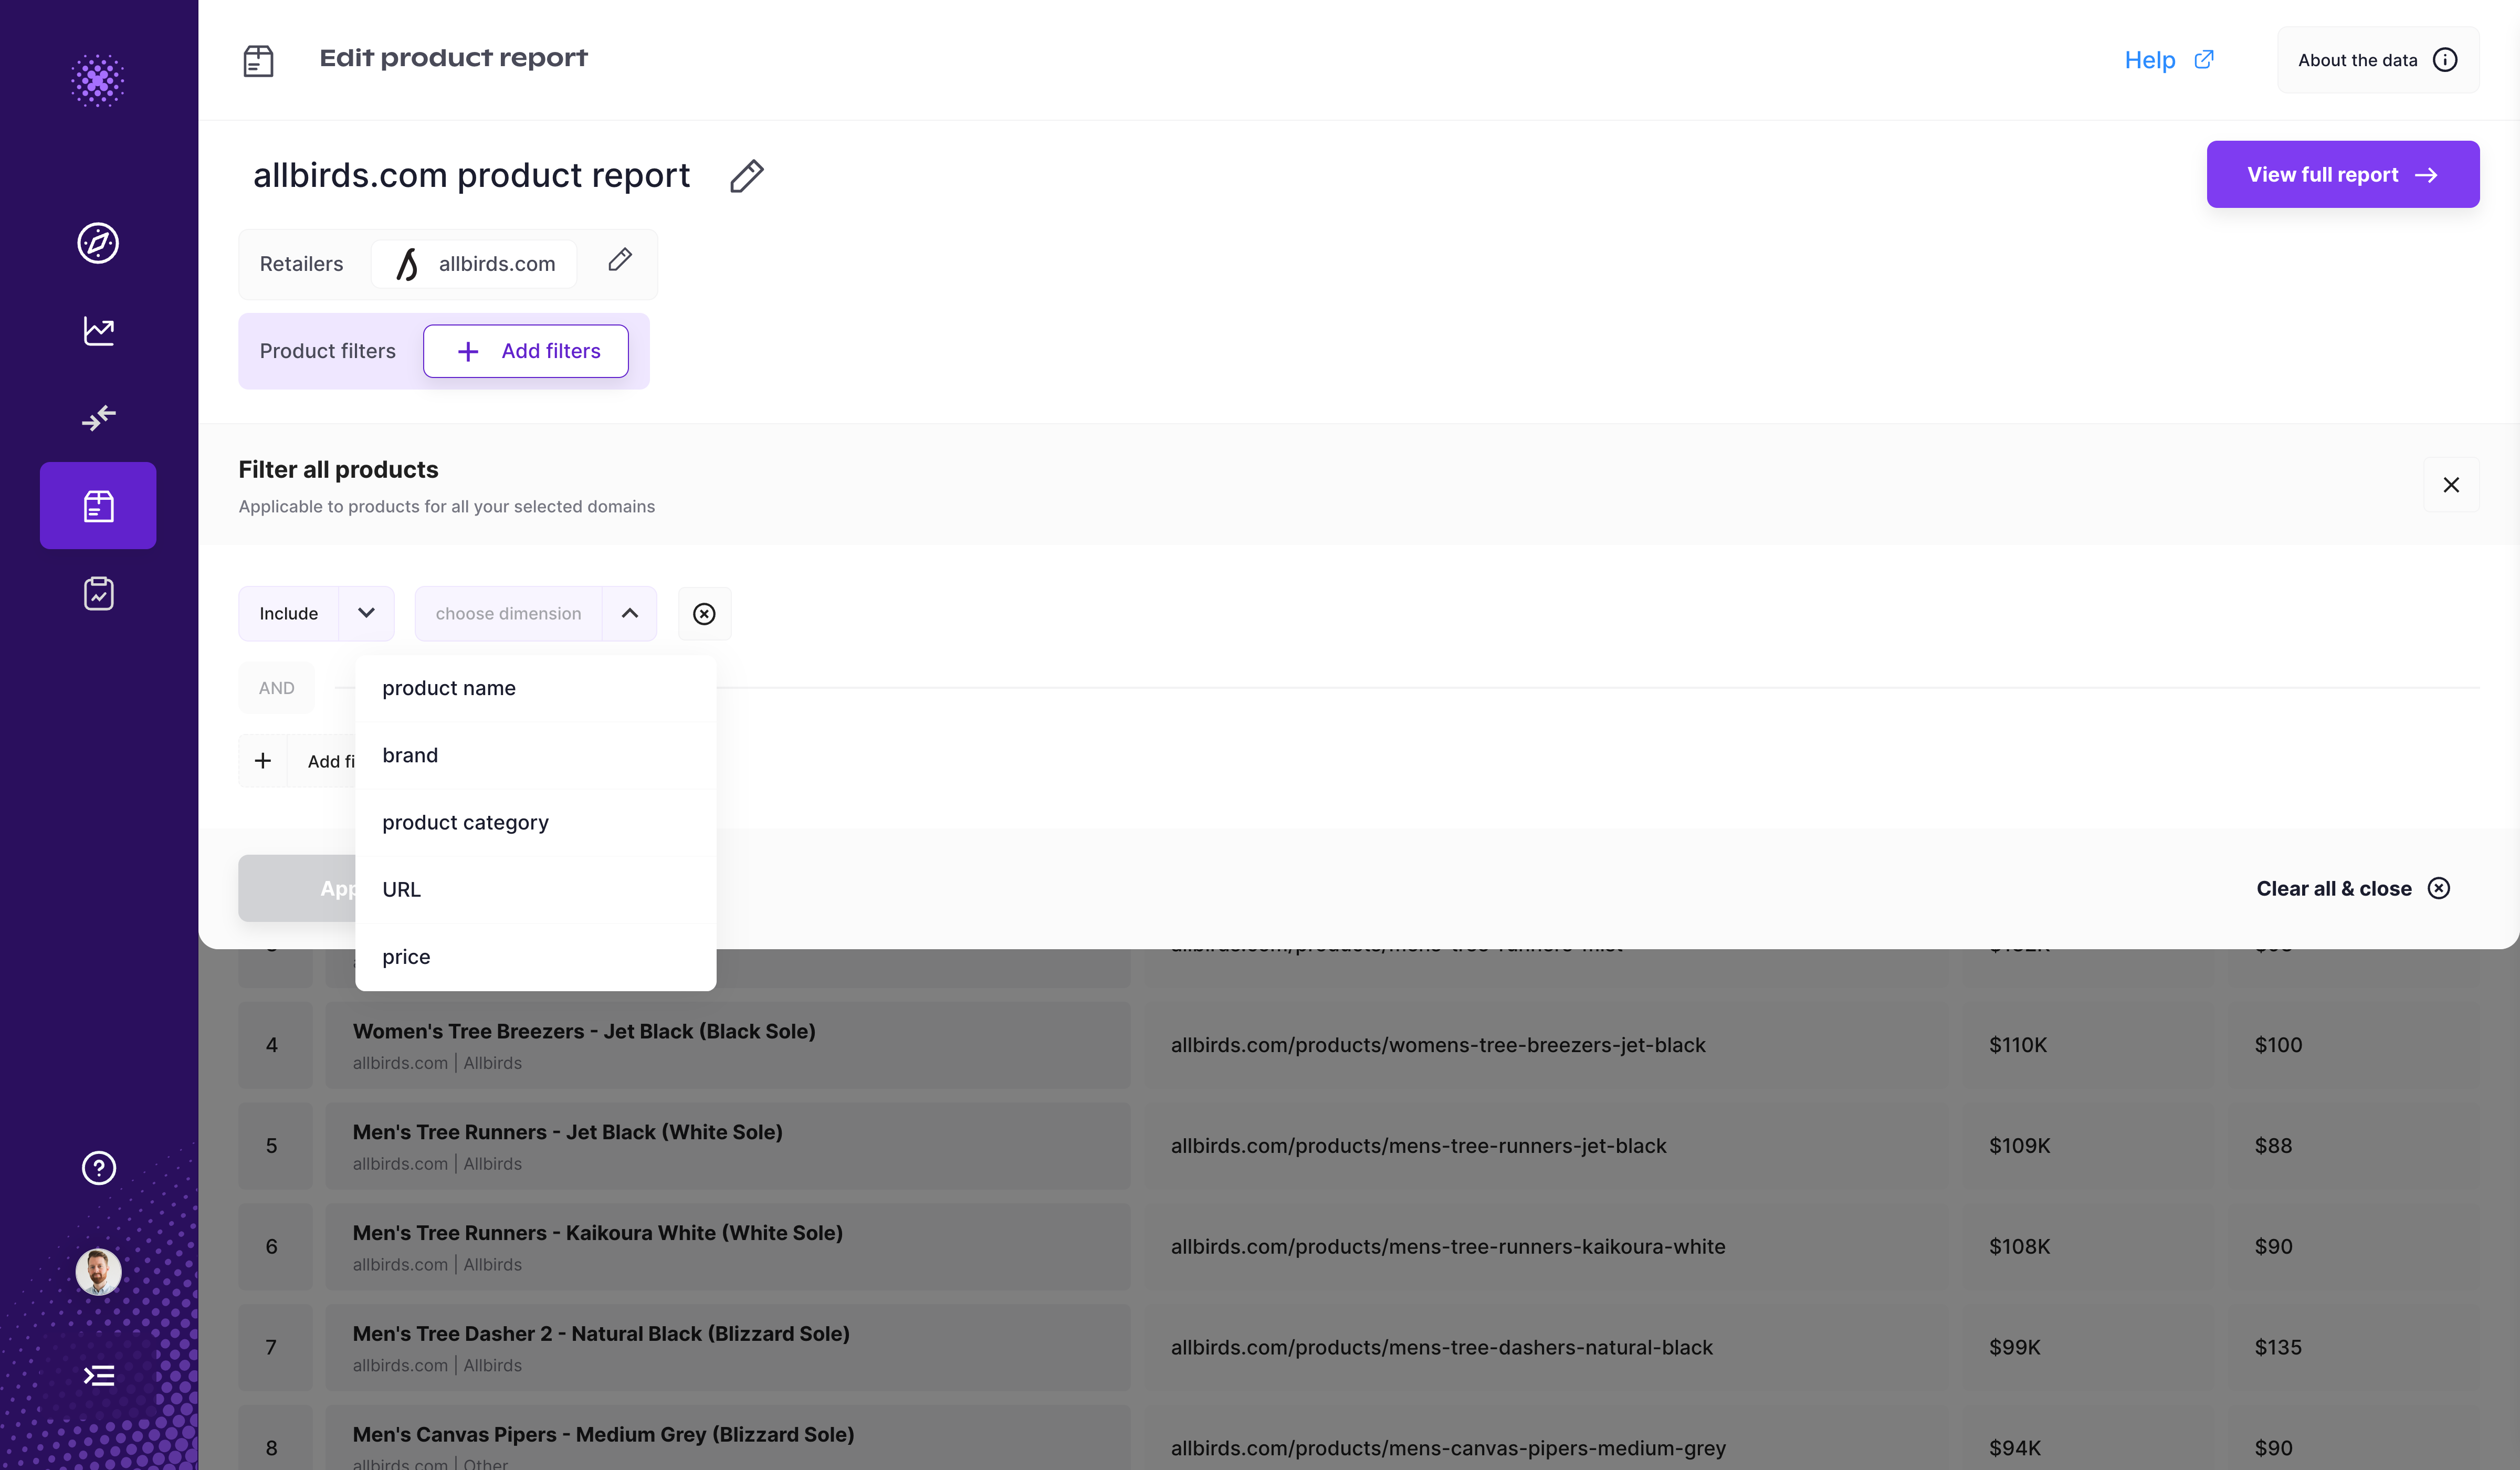
On the first step you select the domains you’d like to include in the report and the segment of products you’d like to include. At this stage you can use advanced filtering for these attributes:
- Product name: name of the product
- Brand: brand or manufacturer of the product
- Product category: product category of the product
- URL: URL of the product
- Price: average price observed for the product in the selected date range

Viewing the report
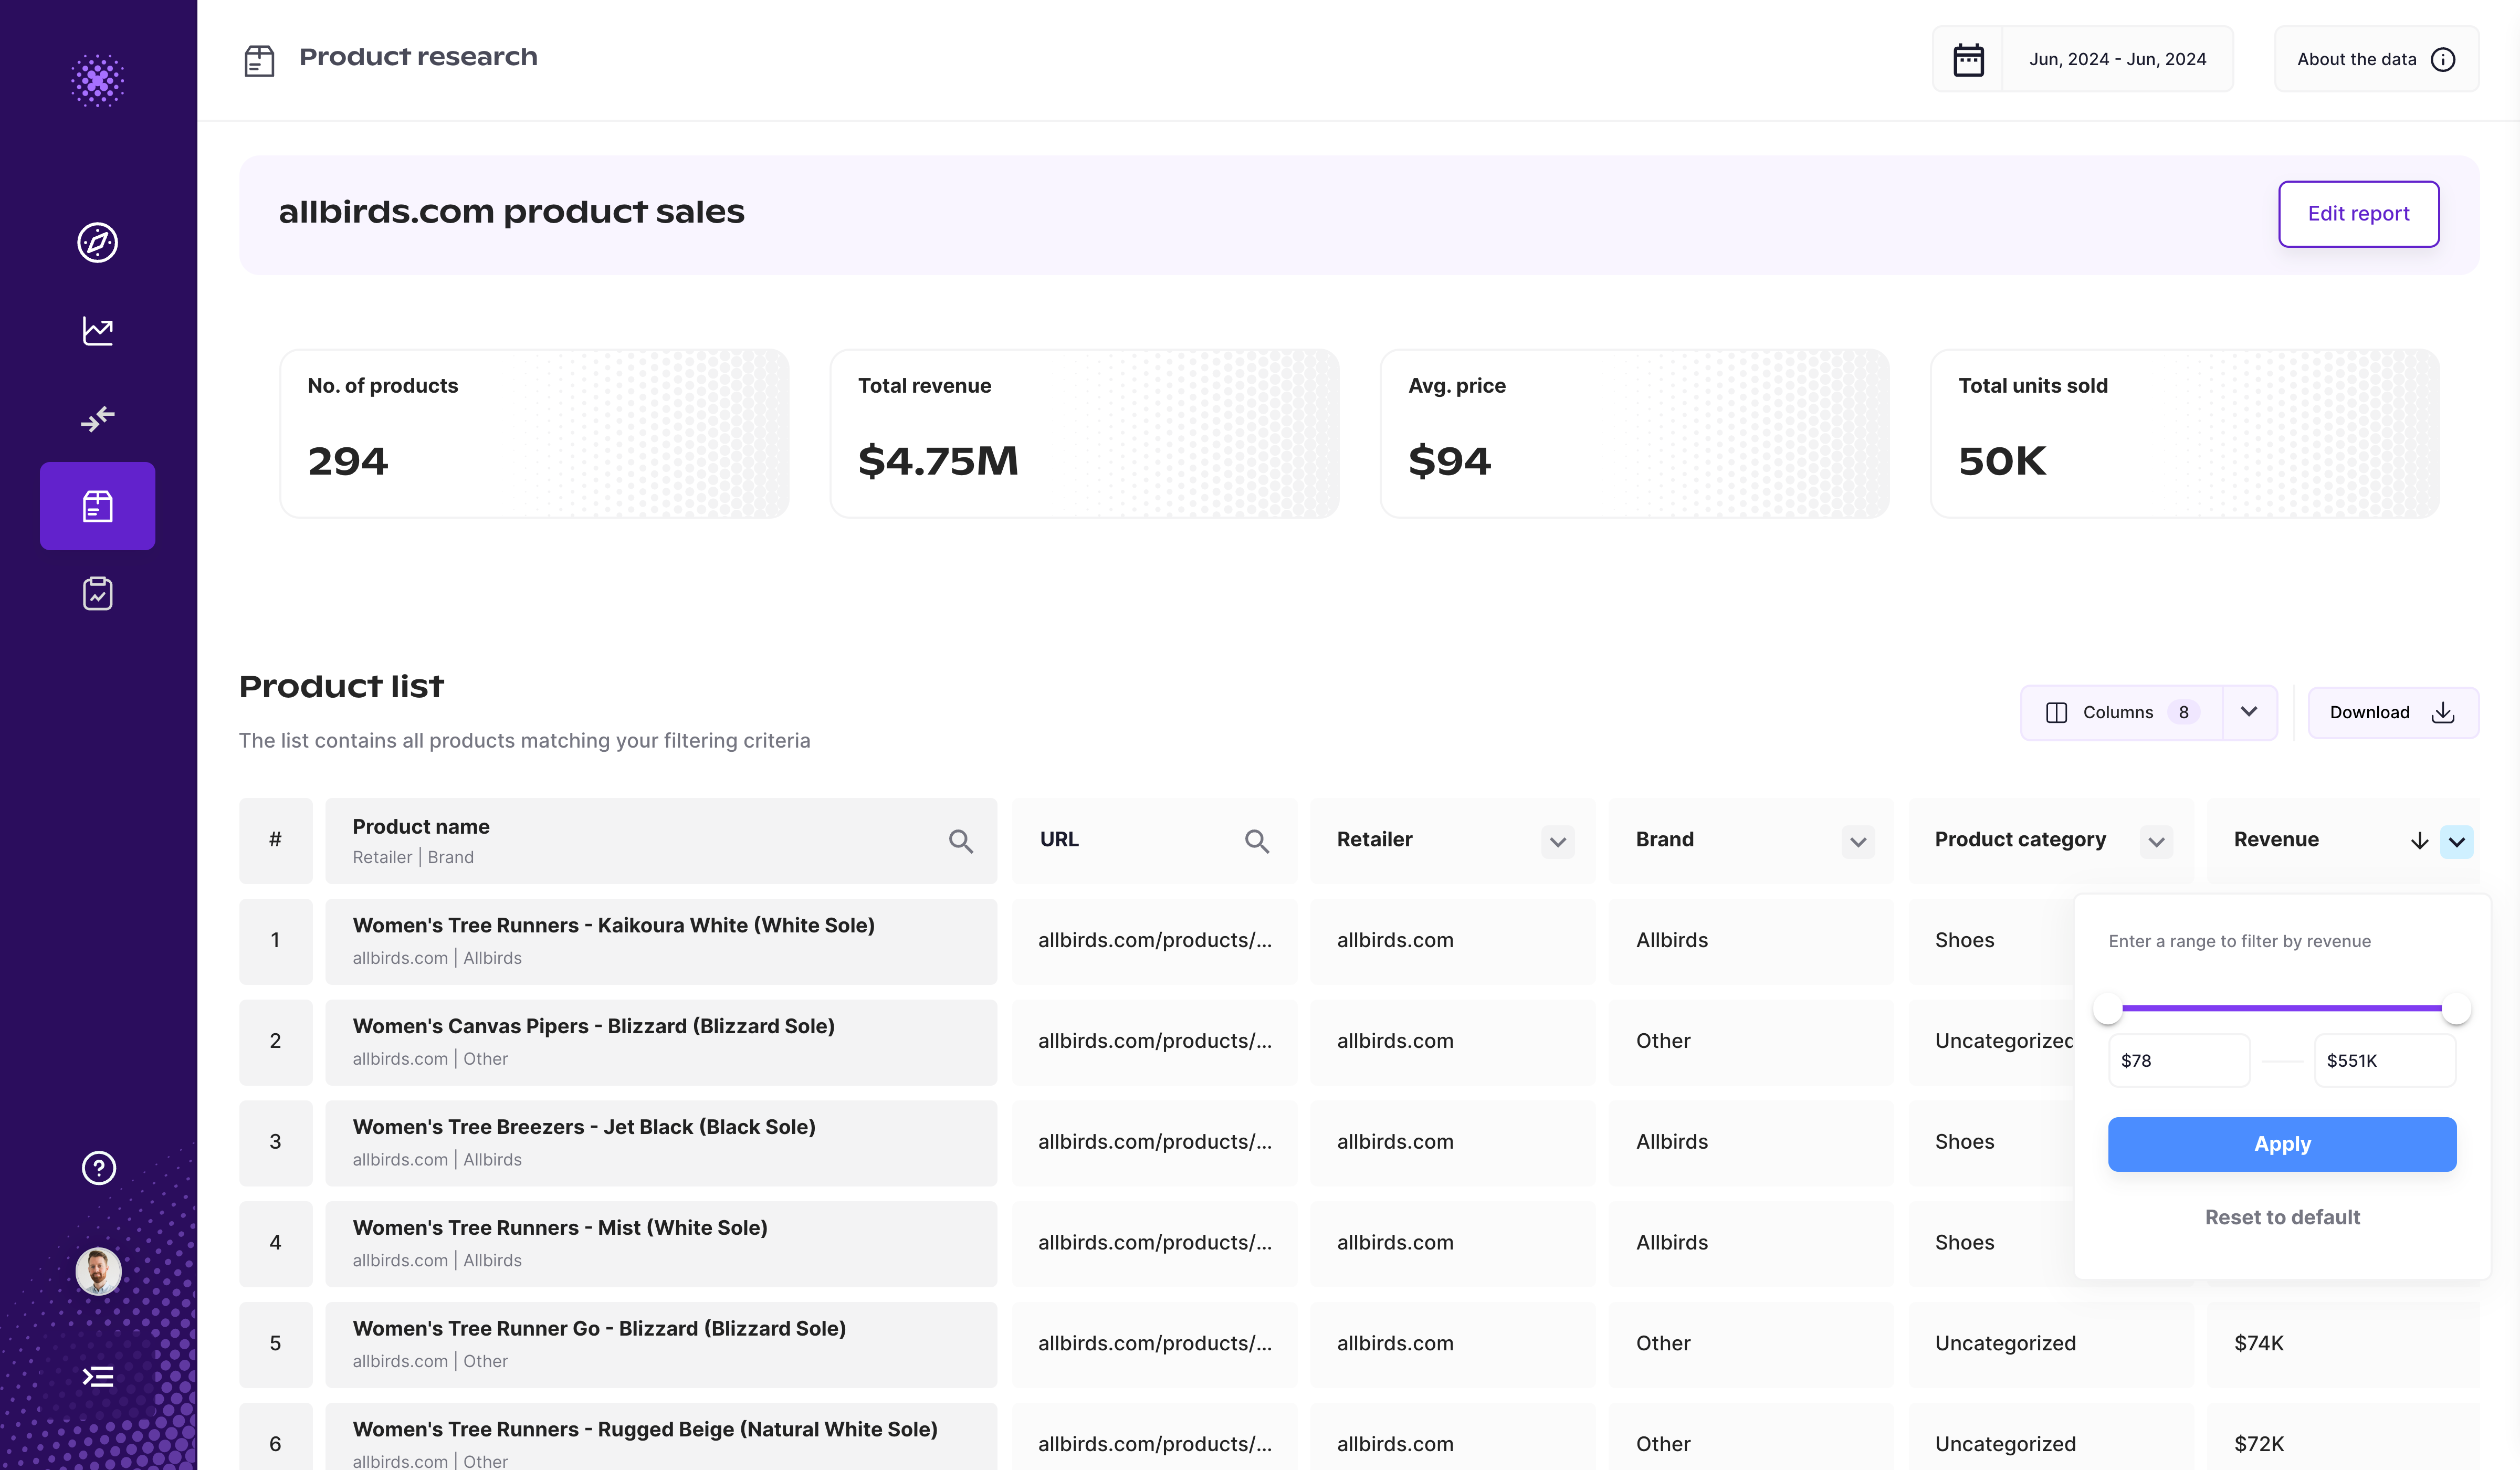
After the configuration is complete, you are ready to view the report. The table is a flexible way to analyze the product sales data, and it represents all the observed products for the current domain being viewed. Each columns of the table can be filtered and sorted:

Part 2: Use cases
Below are the intended use cases for brands for the Product Analysis and exactly how you can configure the report to find the actionable insights to answer these questions.
New product development
For: brands
Example pain point:
What are the products my competitors are successfully selling?
Are there opportunities for me to develop these products as well?
Configuration
To identify the best-selling products, you can sort the report by either revenue or revenue growth. Sorting by revenue will help you see which products have generated the highest total sales within the selected time frame, giving you a clear picture of your top performers. Alternatively, sorting by revenue growth allows you to identify products that are experiencing significant increases in sales over time, which can highlight emerging trends or successful marketing efforts. Both sorting options provide valuable insights, enabling you to focus on the products that are driving your business forward.
Identify product category gaps
For: brands
Example pain point:
Are there successful products in product categories where my competitor brands are selling but I am not?
Configuration
Each domain has an Assortment analysis section where it is possible to understand which product categories the domains is selling the most products from, and which product categories are growing. You can compare this assortment to your brand’s assortment to identify which product categories you aren’t making and selling products for, and which ones have the most potential.
From there you can go to the the Product analysis section to discover exactly which products are driving these sales. Each of the products is categorized, and it is possible to filter the products by the available product categories, and then sort any of the product performance columns (revenue, price, items sold), which will give you insights into potential next products to manufacture.
Improve D2C strategies
For: brands
Example pain point:
How can I improve my D2C by looking at what is successful at other retailers for my products?
Configuration
Lookup a retailer that is selling your brand’s products, use the brand filter on the Product analysis table, and sort the revenue column descending. With this view you will now understand your top selling products for this retailer. From there, you can also analyze further the retailer page, such as their acquisition channels, device performance and more to get a more wholistic understanding how you can improve your d2c store.
Pricing strategies
For: brands and retailers
Example pain point:
Possible to observe price changes, but no insight into how pricing changes actually influences volume and revenue
Configuration
Using the time series data you are able to plot the price and revenue for individual products. From there you can observe which products had price changes, and then how the revenue was impacted.
Identify new products to sell
For: retailers
Example pain point:
Which products should I start to sell?
Which brands and product categories am I missing from my assortment?
Configuration
Identify a set of competitor stores and start by looking at the Assortment analysis section, and understand if there are certain brands or product categories that are generating a lot of sales and are growing, which your store currently doesn’t include. From there, you can use the Product analysis table to discover which of the products within those new categories or brands are selling the best.