Overview
This guide will walk you through how to access category data and how you can use the category features to drive e-commerce sales for your business. This section can help with the following use cases:
- Market sizing for online sales of > 5k product categories in the US, UK and DE
- Identifying the retailers selling in the product categories
- Identifying the brands selling in the product categories
- Understand the growing/declining product categories
- Pricing by brand and retailer in the product category
Here is a brief video introduction:
Market sizing
In the top overview section we can see the revenue, units sold, average price, count of retailers and product count for the product category:
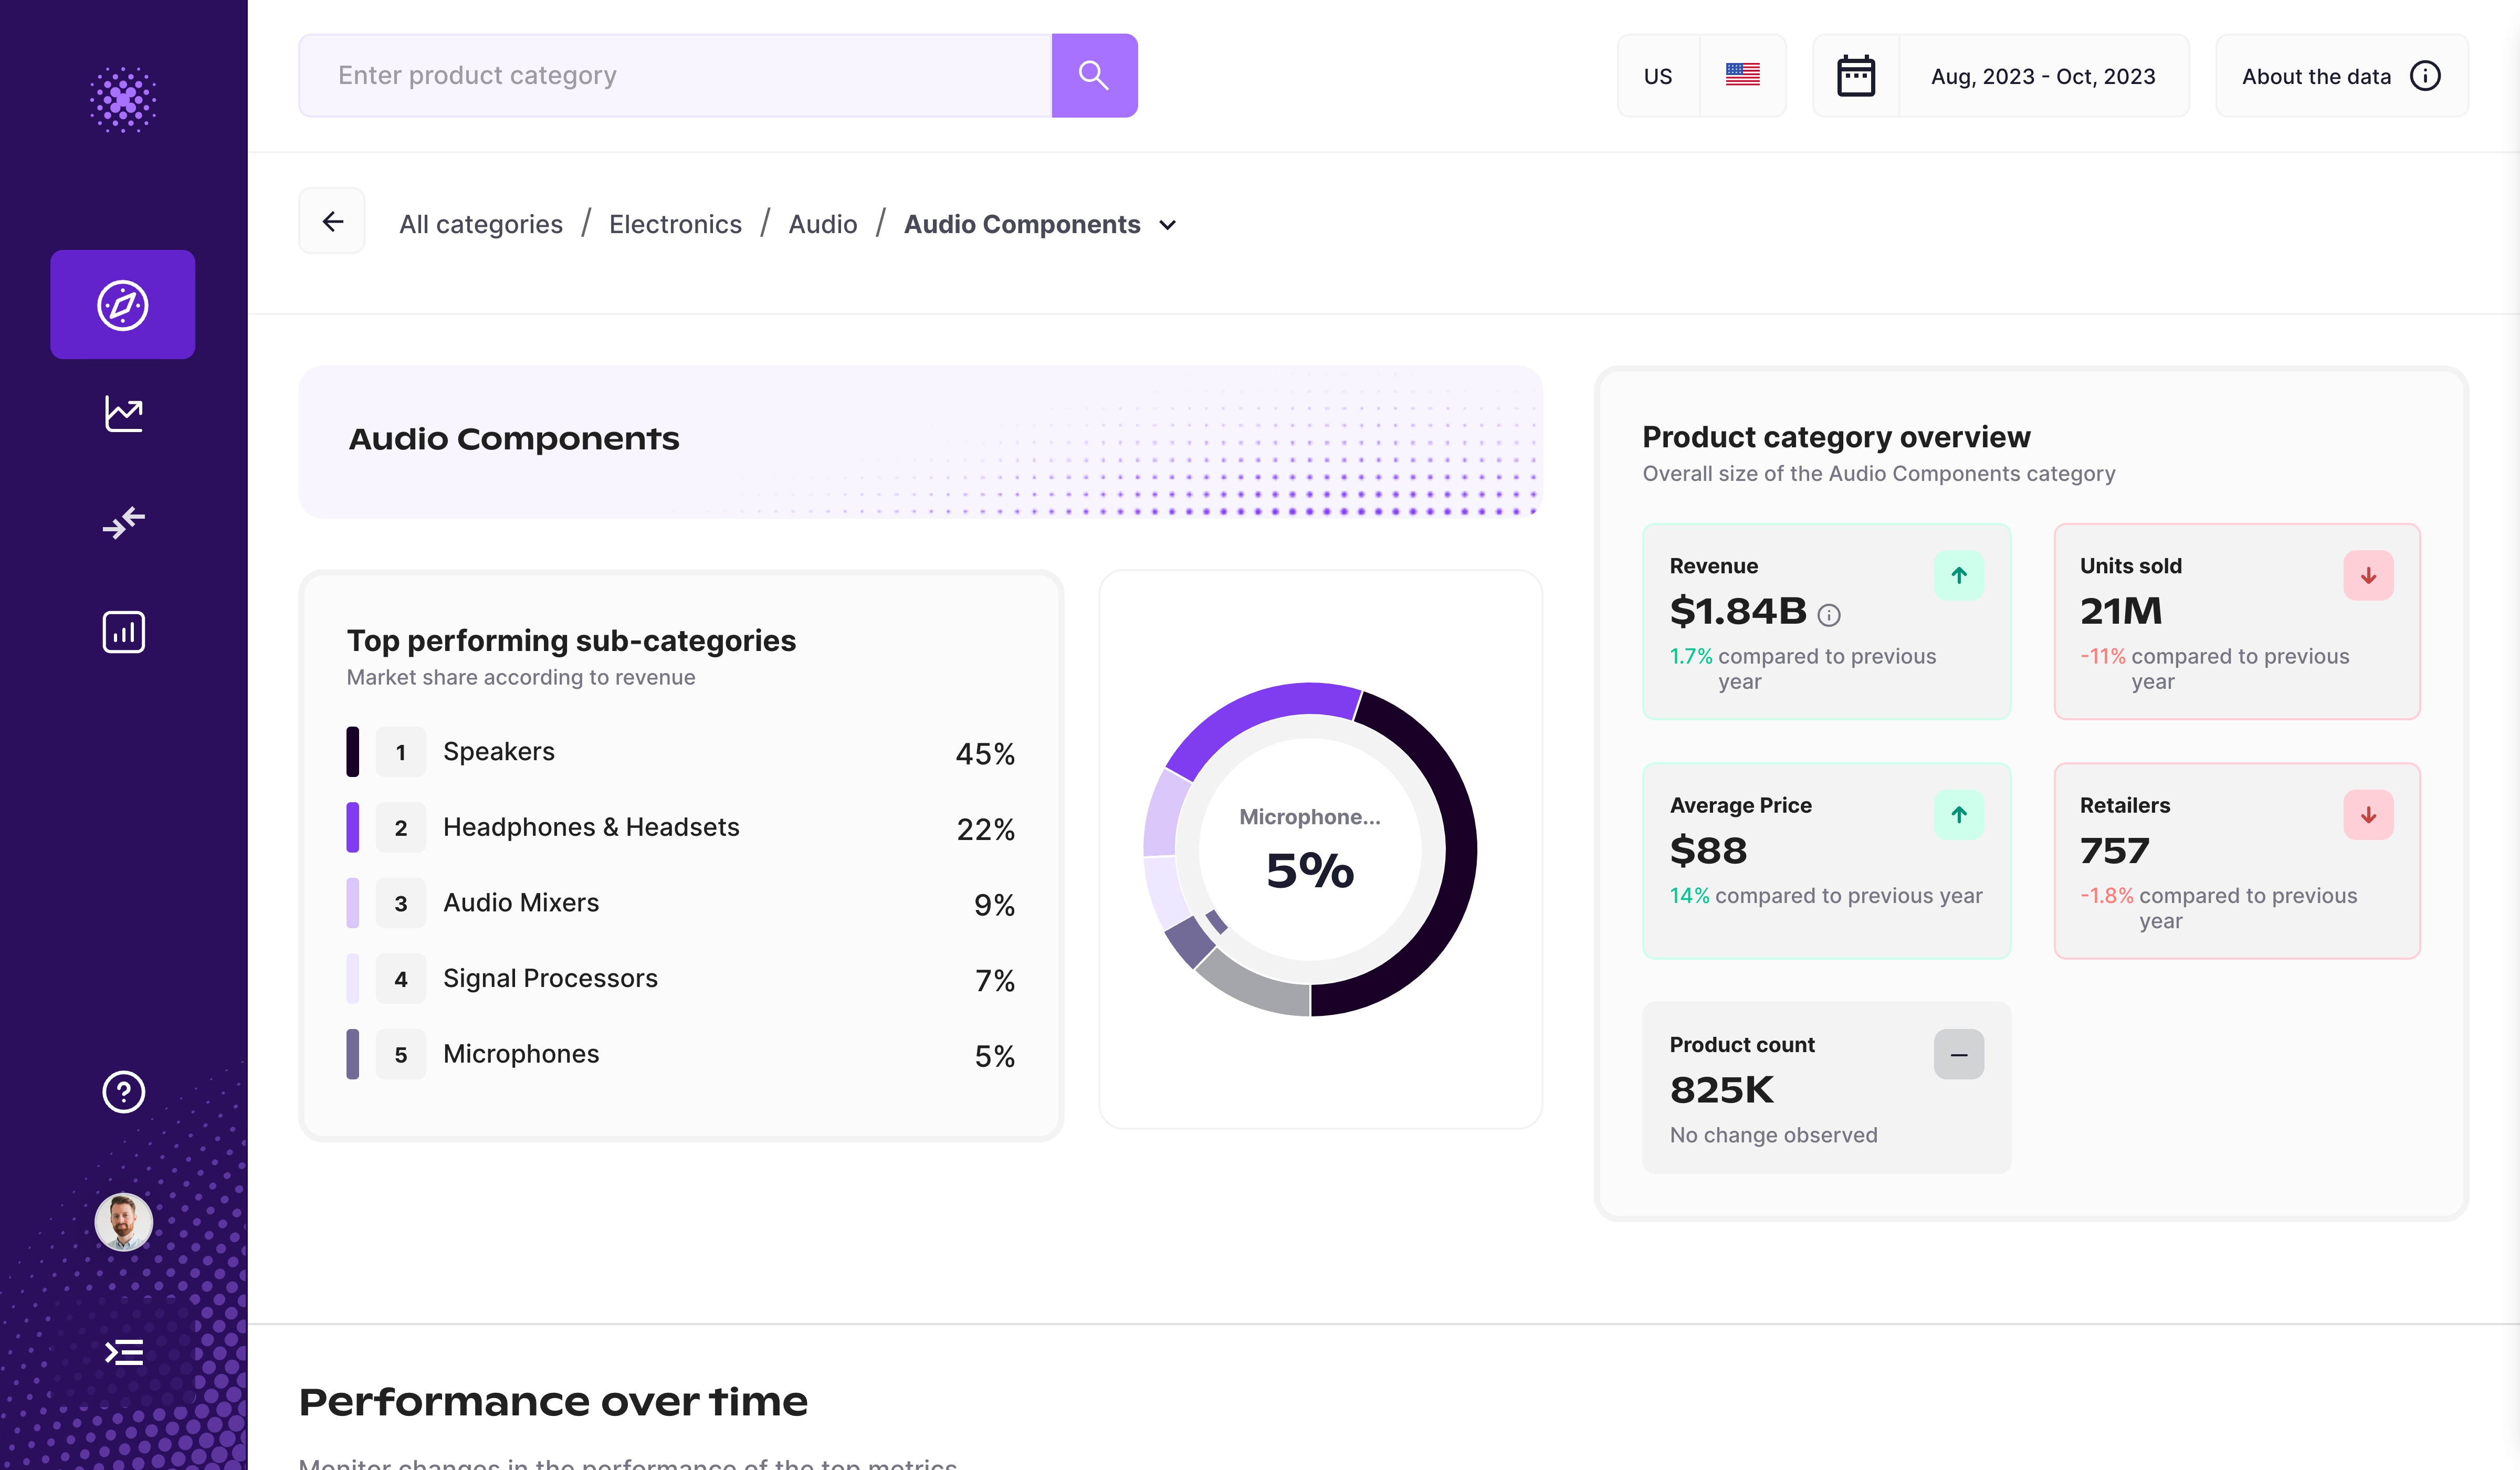
Additionally, if you look at a parent level, we’ll show you the top performing child categories of this to help you understand more specifically which types of products are driving market share for this overall category. And if you look at a parent level, we’ll show you the top performing child categories of this to help you understand more specifically which types of products are driving market share for this overall category.
Performance over time
For your selected category, you can review how it has performed historically over your selected time period. Use this chart to understand seasonal performance for the category and pinpoint when this category sees growth.
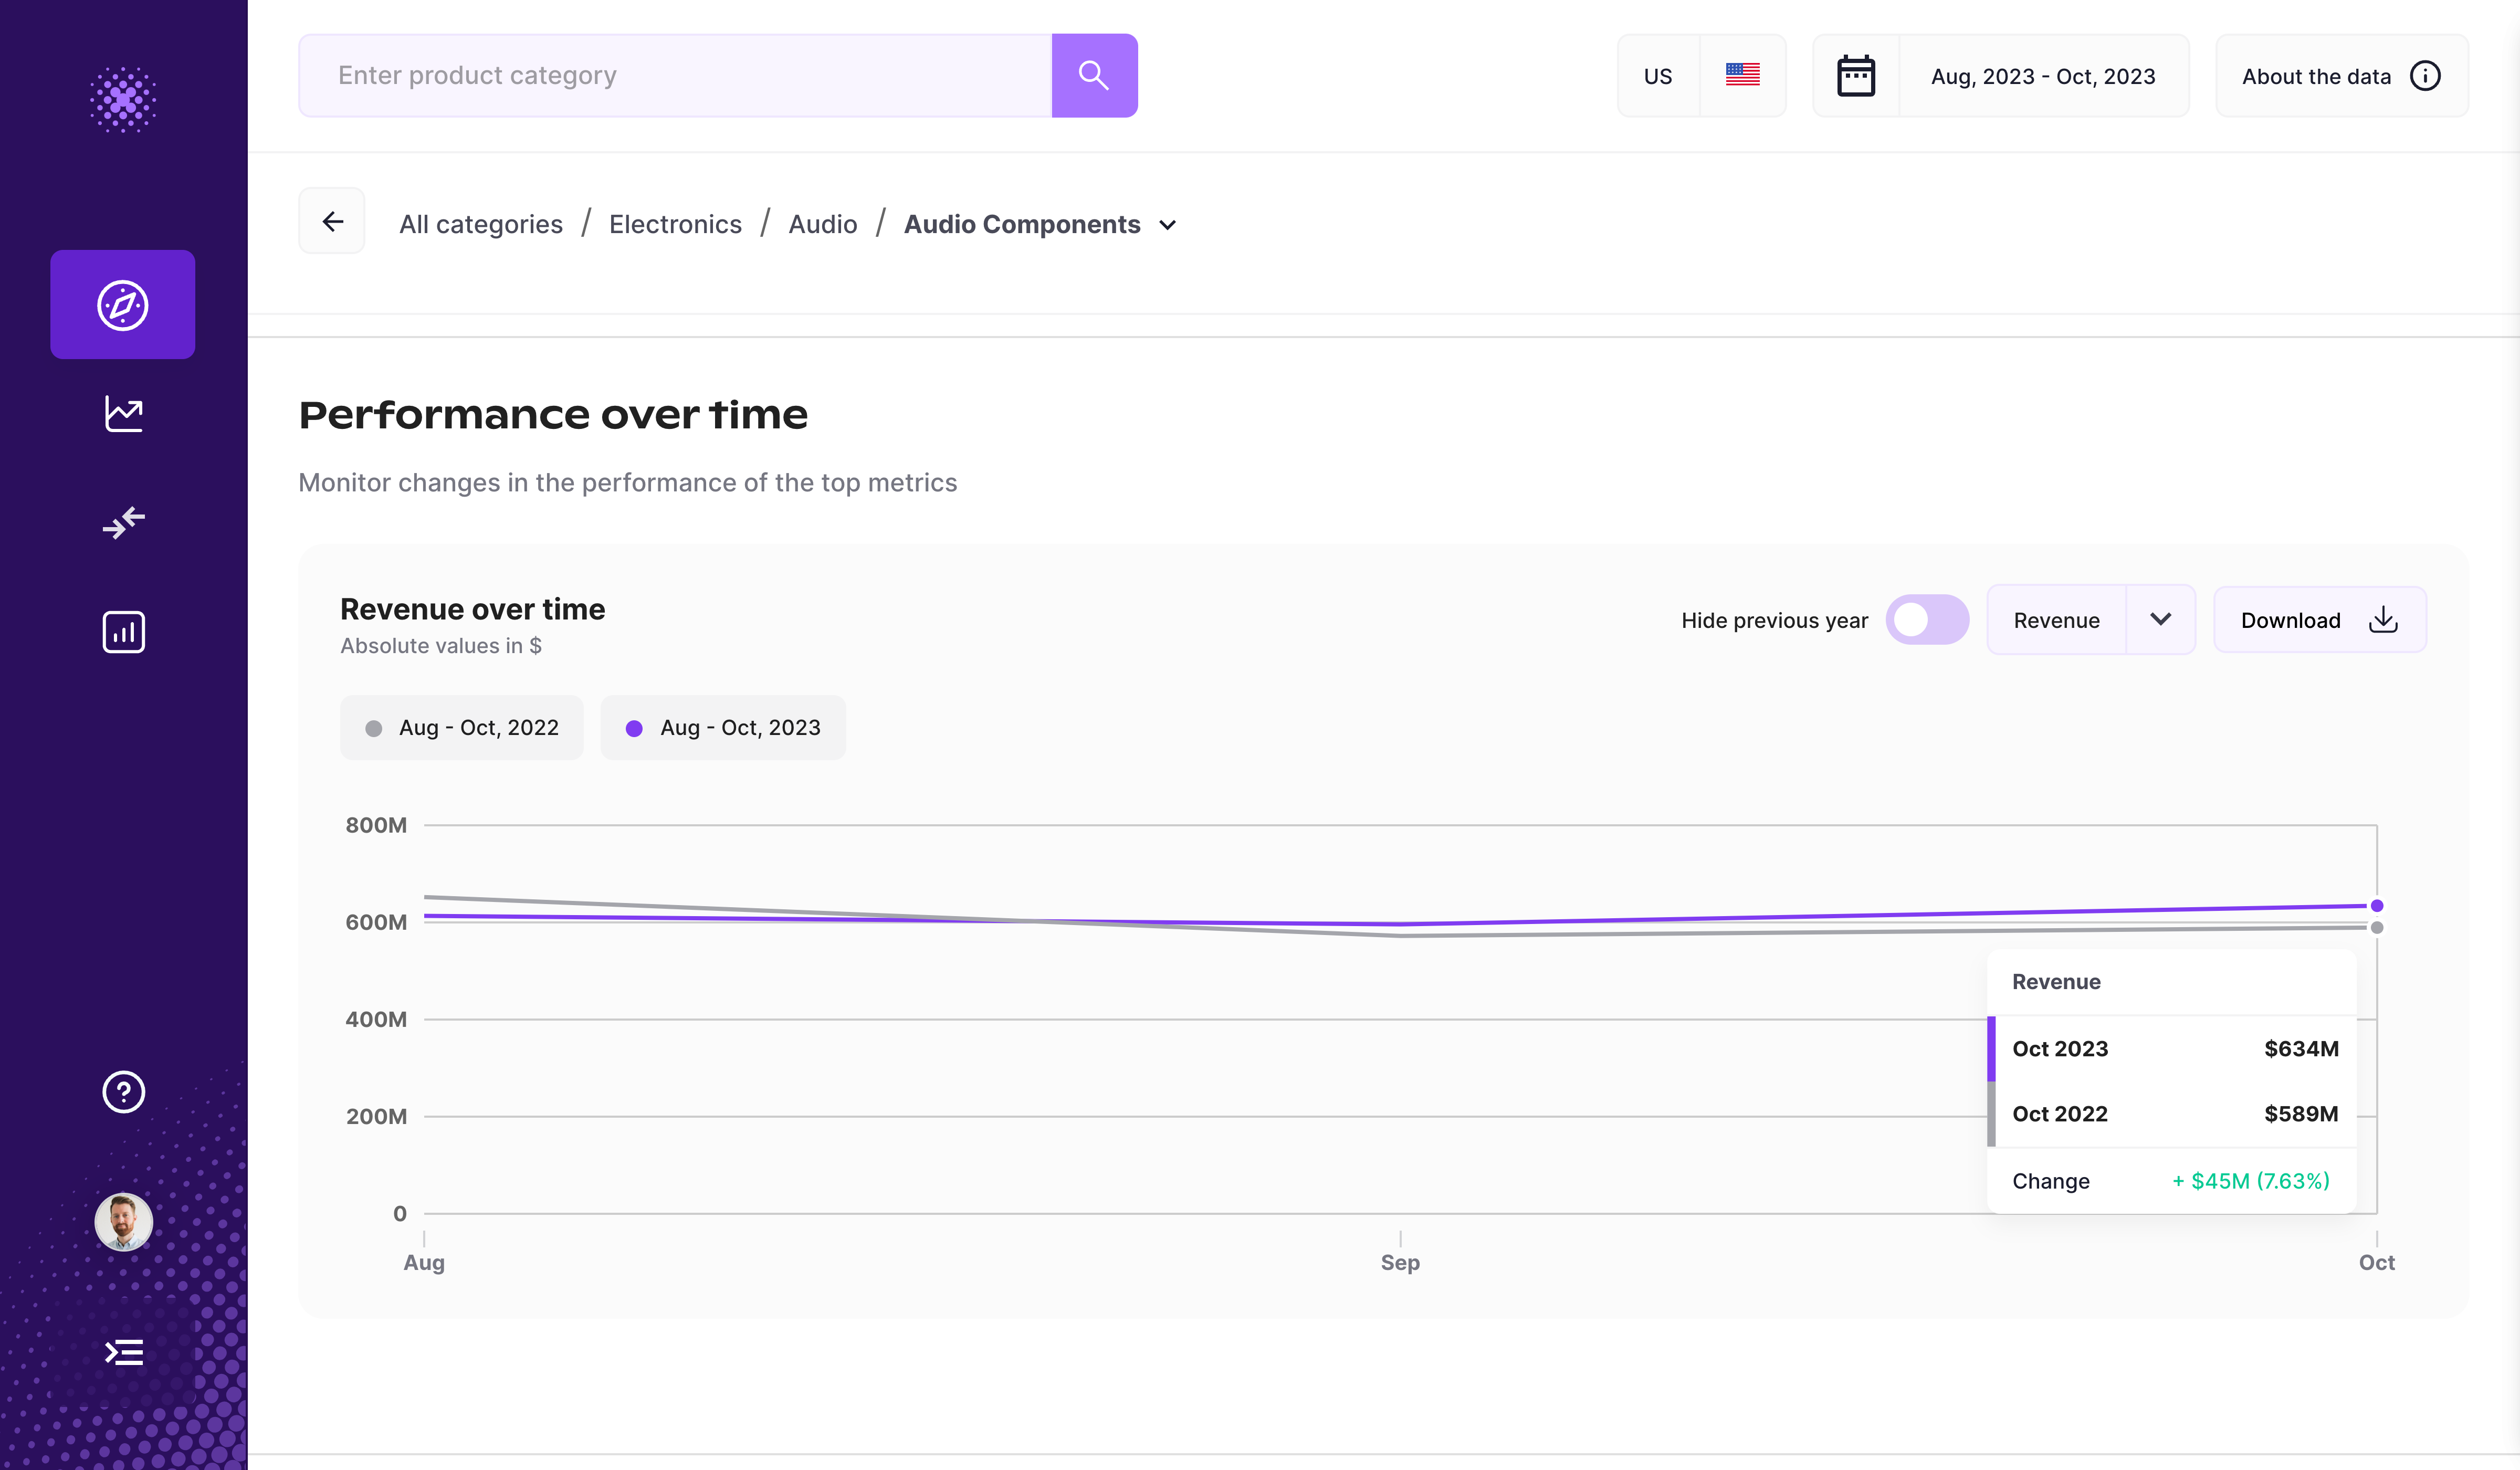
Use the dropdown to view performance over time for all the different metrics available within Grips.
Need the data behind this? Click on the download button to export this data out of the Grips Platform.
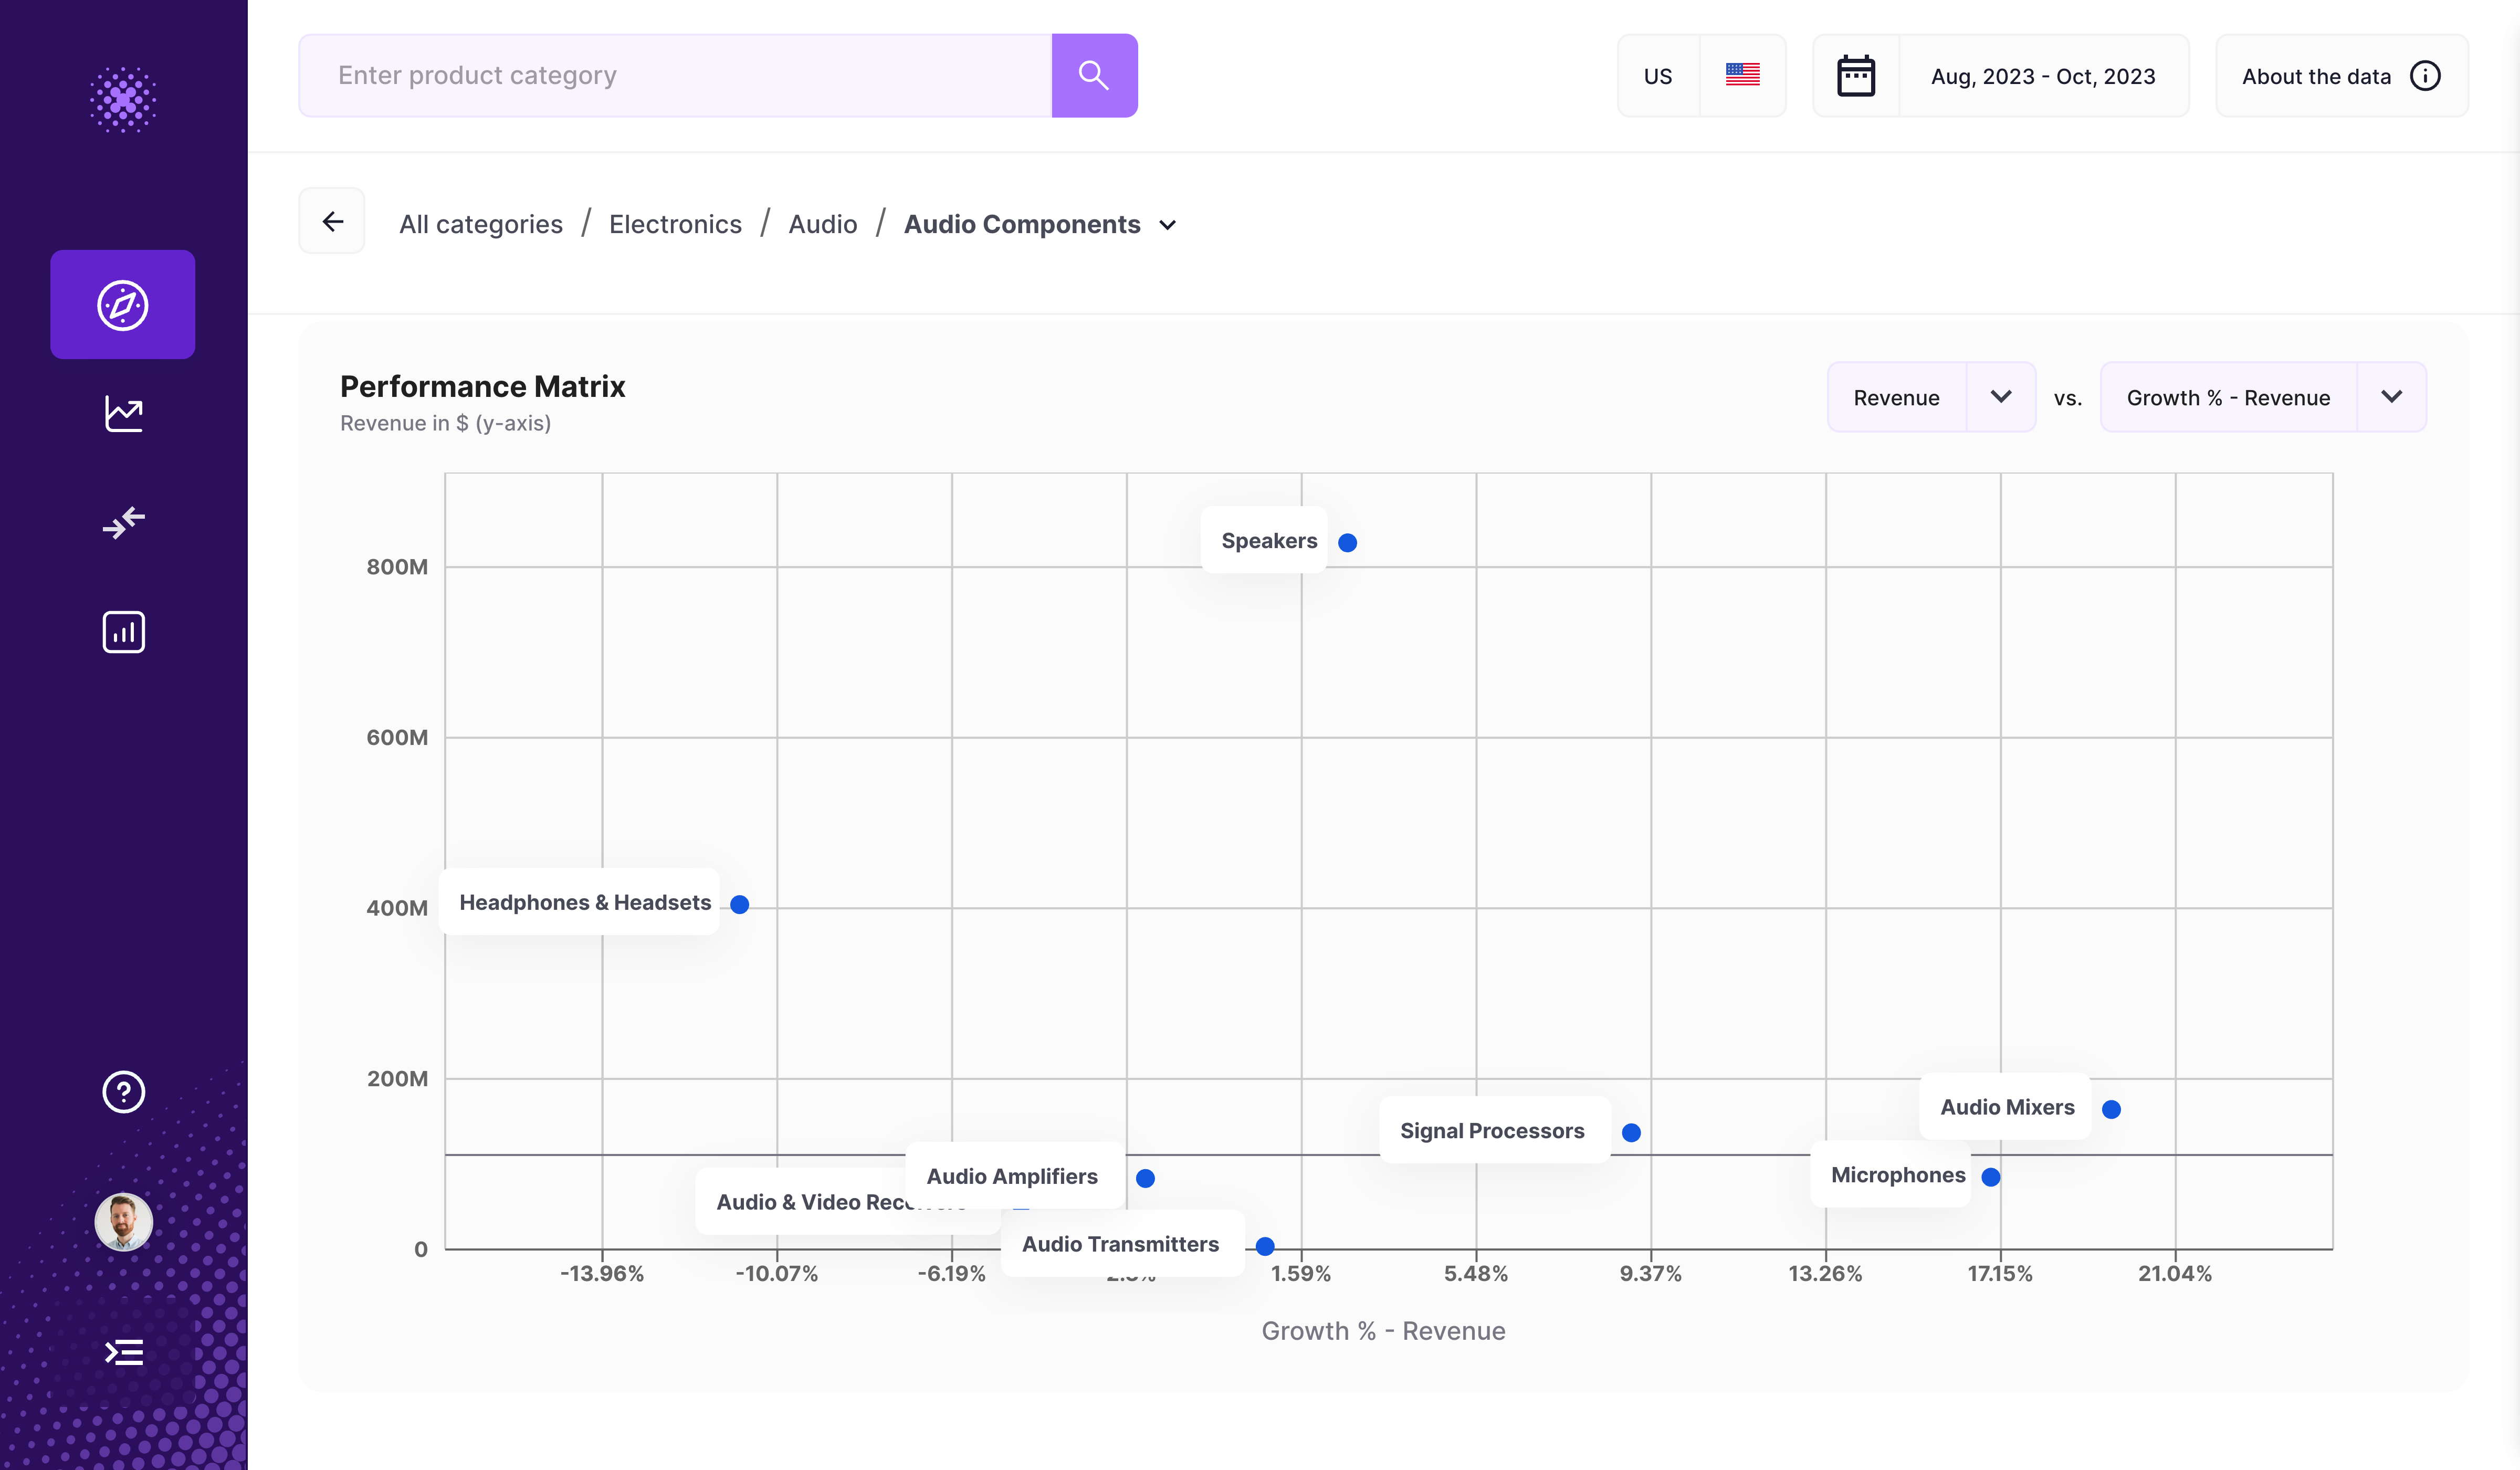
Top growing product categories
With the matrix chart it is possible to look at product categories by revenue and revenue growth:
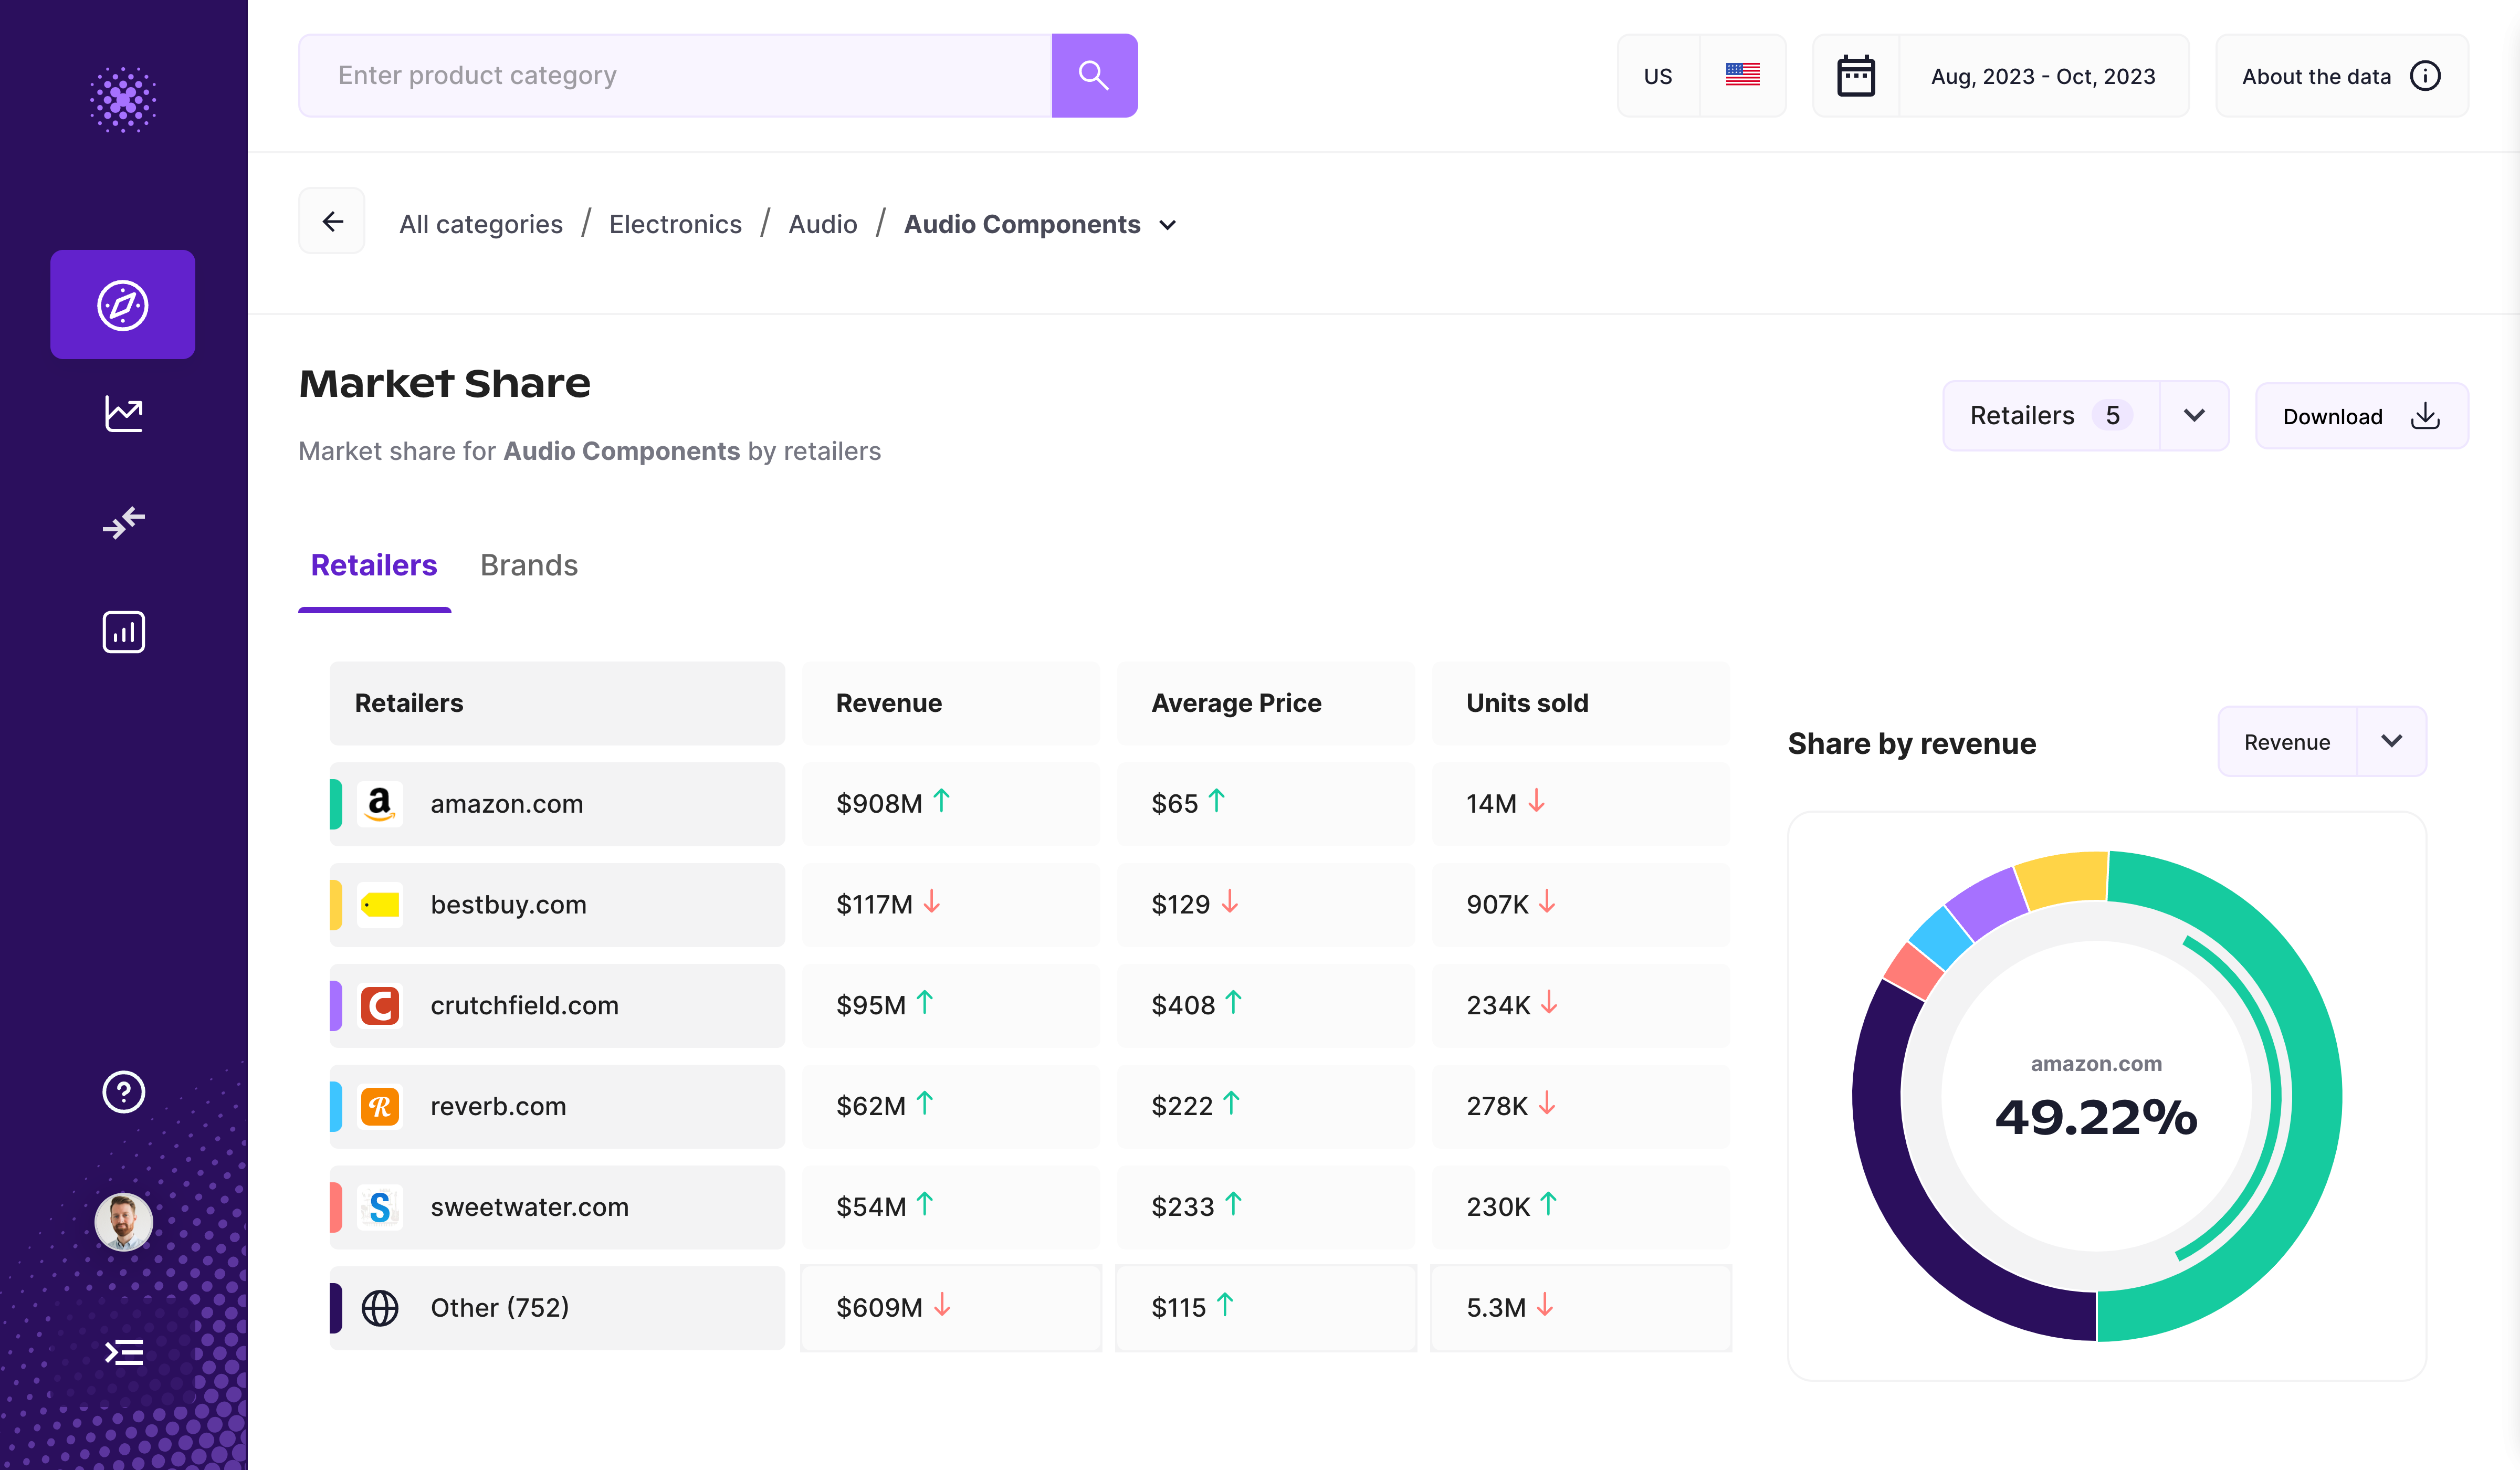
Market share
The market share section shows you the retailer and brand breakdown of the selected category. See which retailers have the highest market share and the associated revenue and units sold:
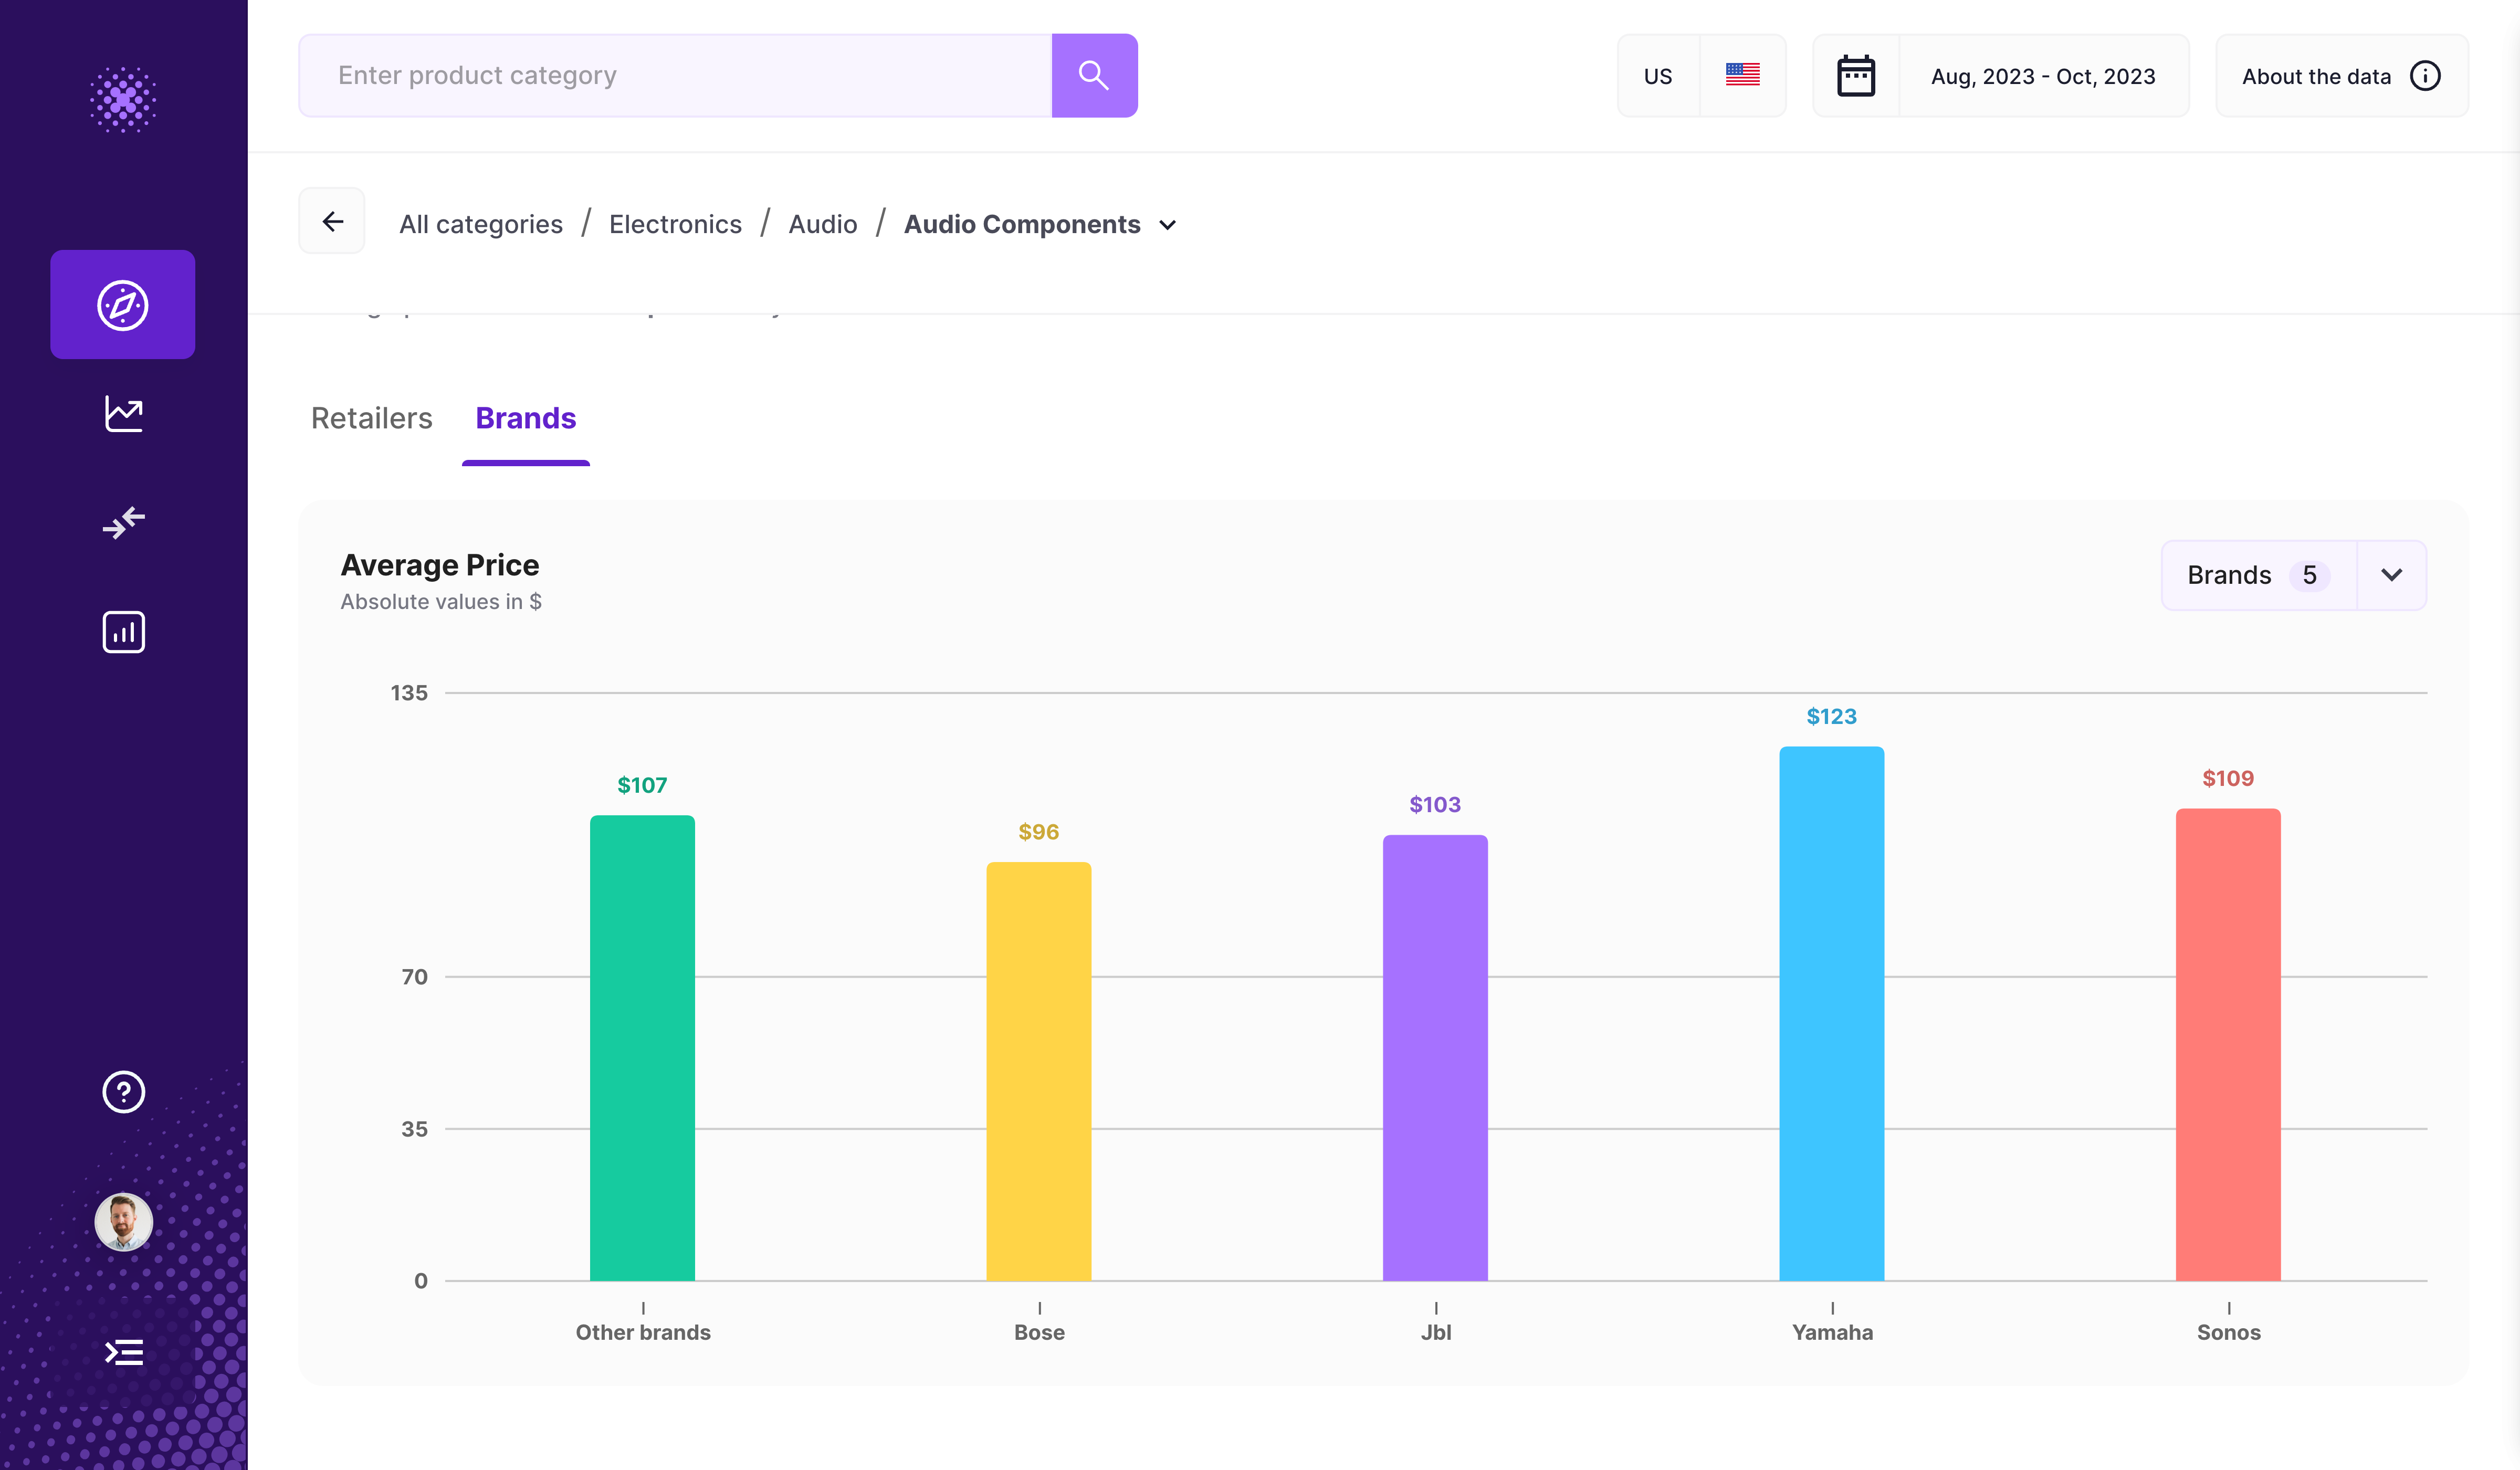
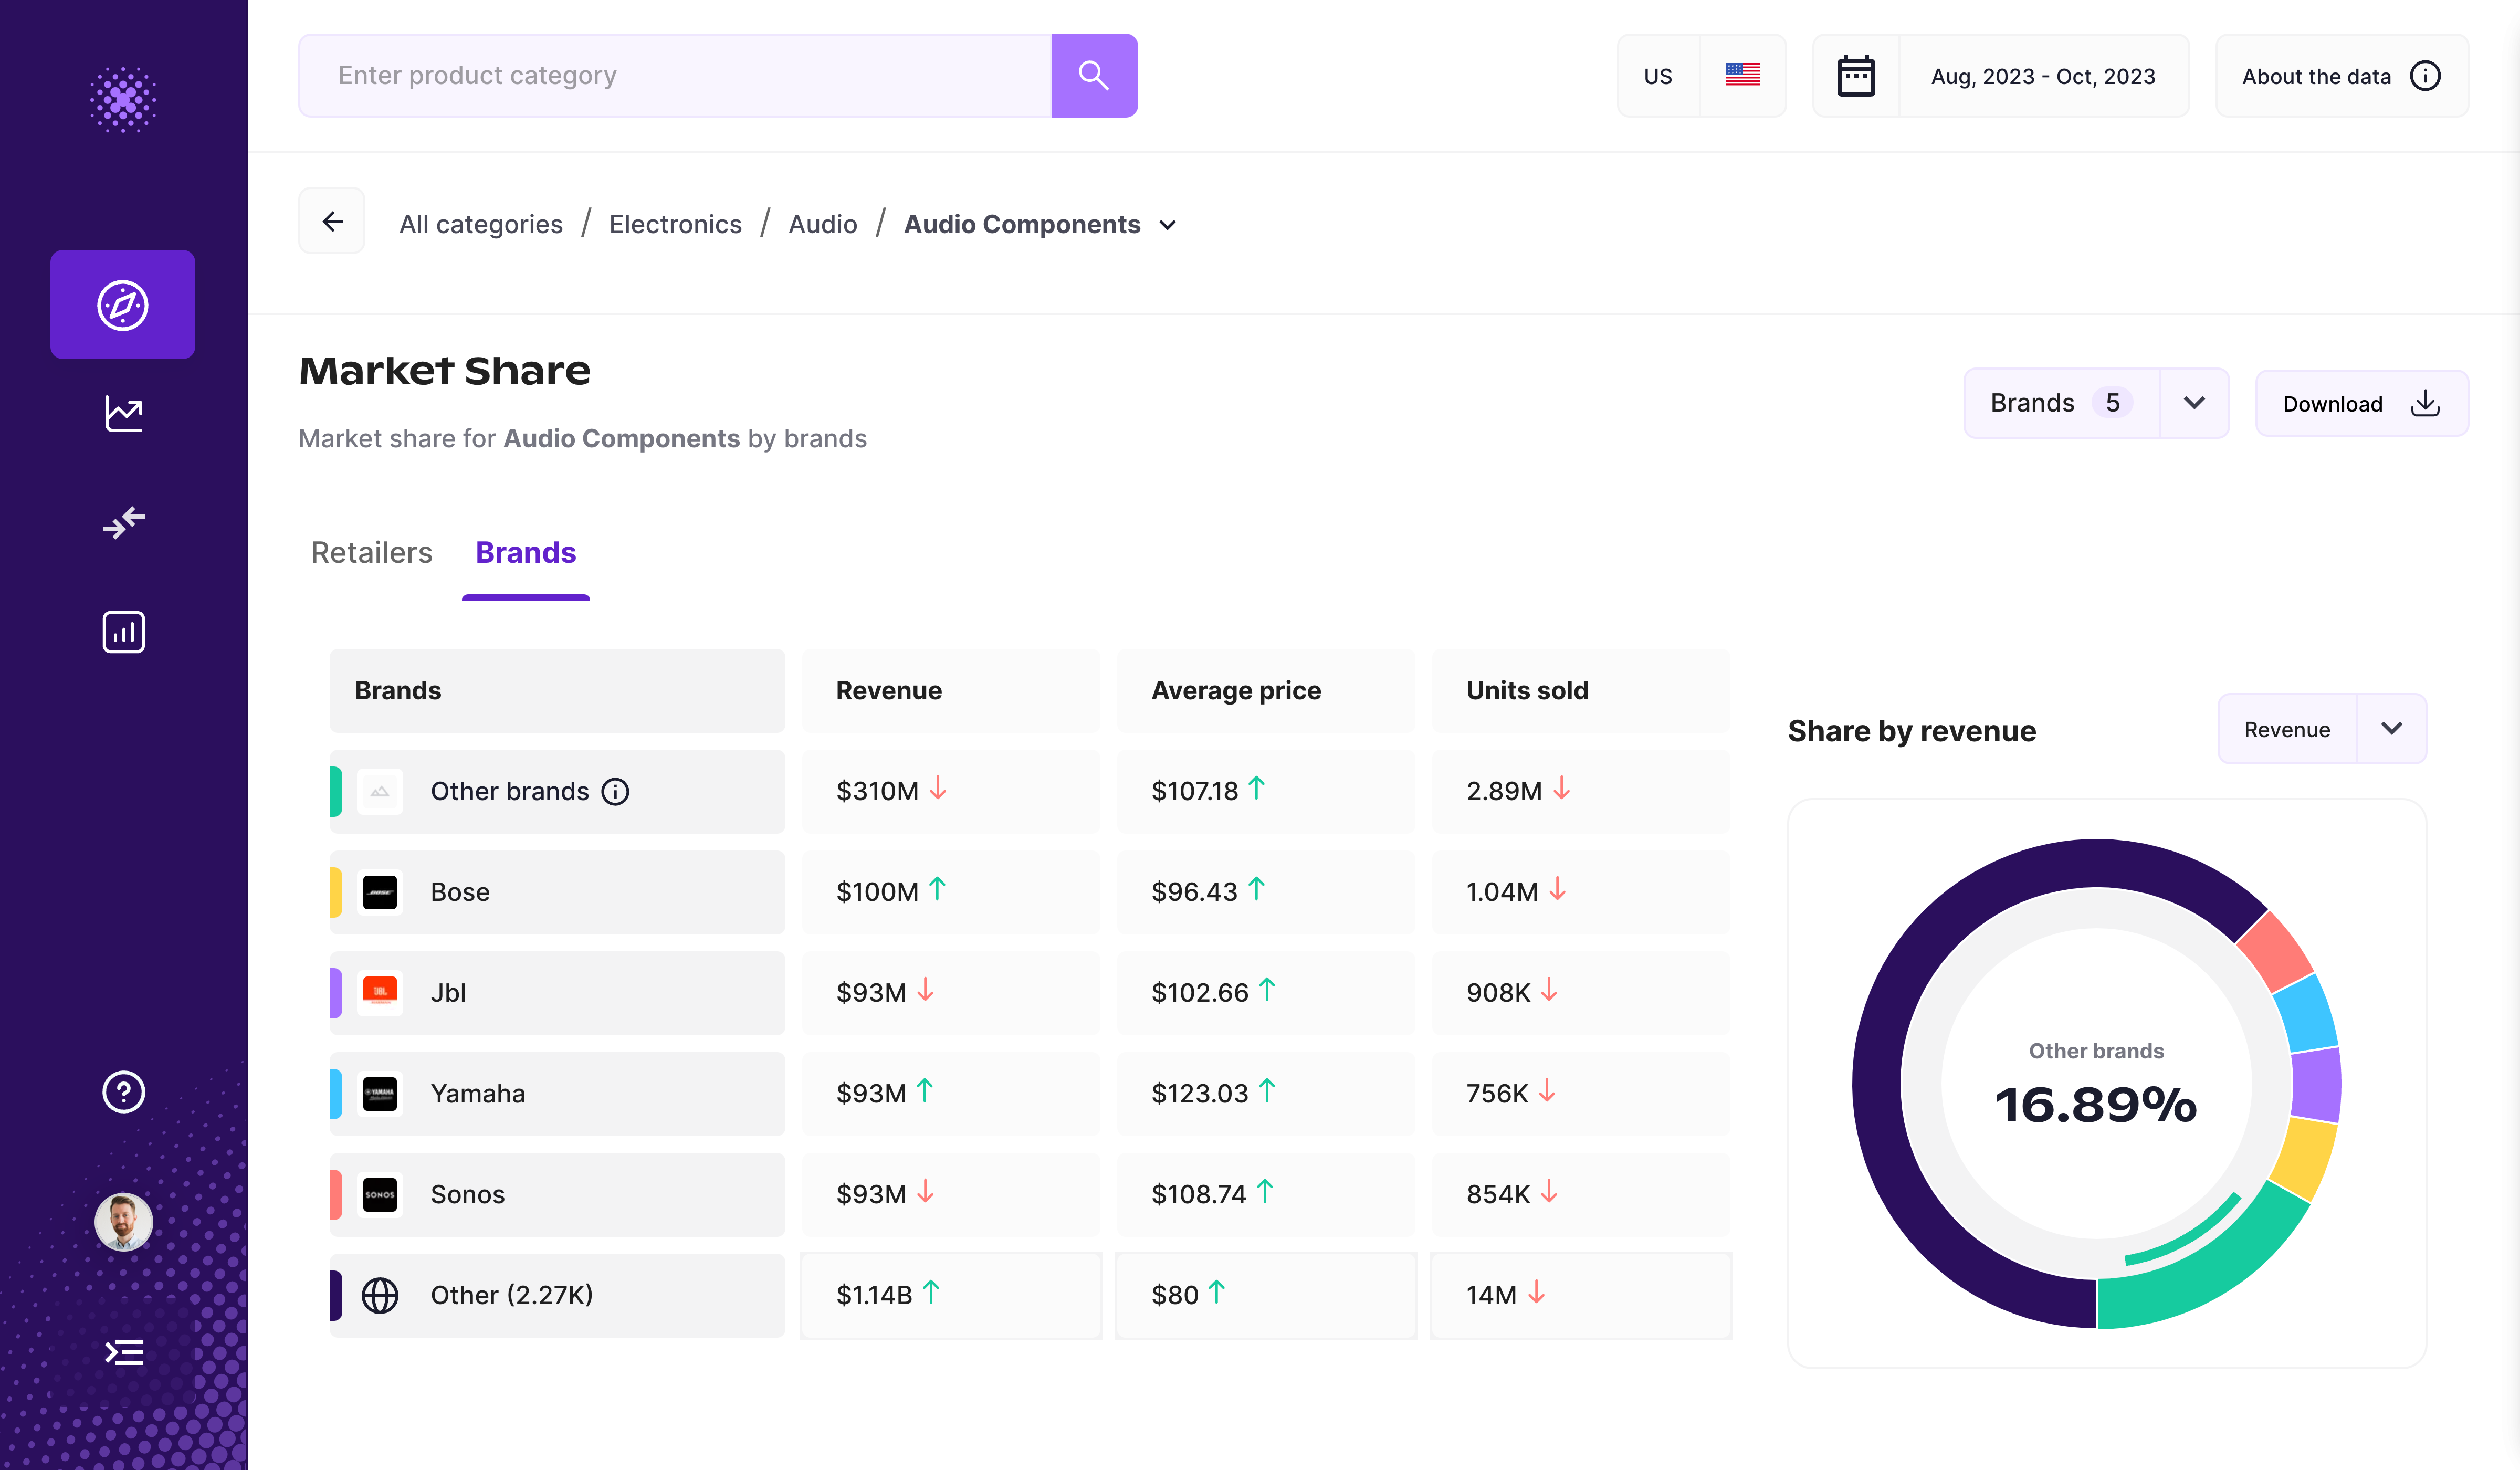
And the same for brands;
Need the data behind this? Click on the download button to export this data out of the Grips Platform.
Retailer price breakdown
The retailer price breakdown section shows the average price of retailers within the selected category. Again you can pick the 5 retailers you’d like to compare by clicking on the retailers dropdown button.
This section allows you to compare the pricing strategy of retailers.