article

Apparel & Accessories category analysis

Read this exclusive report revealing competitive intelligence on the Apparel & Accessories and Shoe market in the US, UK and Germany, including total e-commerce revenue, best-selling categories, top retailers and pricing.
John Fetto
10 min read
11 July 2023

Market sizing

Q1 Apparel & Accessories sales online hit $15.6 billion

Grips reports that e-commerce sales of Apparel & Accessories in the US, UK and Germany during Q1 2023 surpassed $15.6 billion from over 210 million distinct transactions or purchase events. The US accounted for roughly three quarters of both revenue and purchases.

The average price of a apparel or an accessory sold online in the United Kingdom was slightly lower at $50. In the US and Germany, consumers spent approximately $52.

These findings come from Grips’ Competitive Intelligence platform, which reveals key metrics for e-commerce, including purchases, units sold, revenue, top sites and more for thousands of unique product categories. The findings in this report represent sales of over five million tracked Apparel & Accessories items sold across more than 7,600 leading domains.


revenue, purchases, unit sales and average price for apparel & accessories category in the US, UK and Germany

Revenue by product category

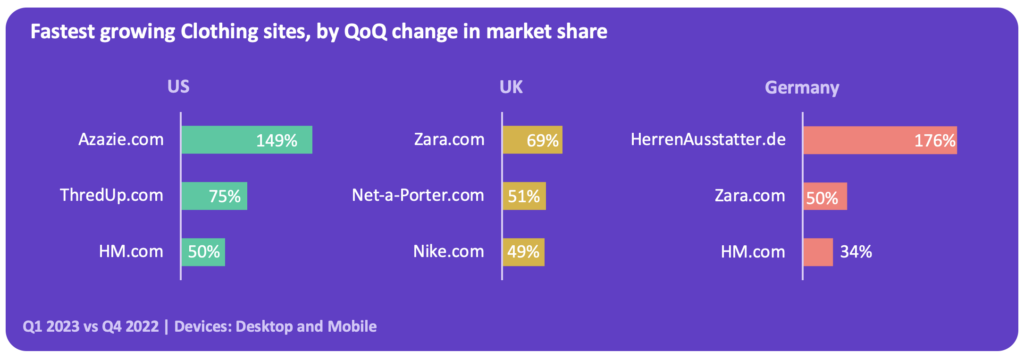
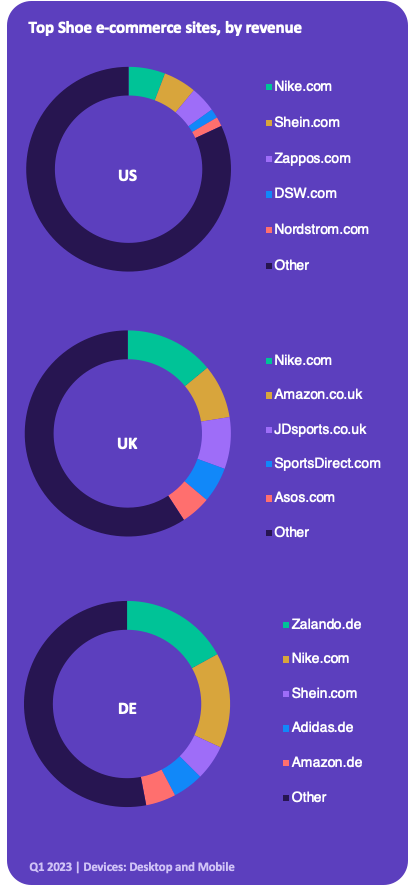
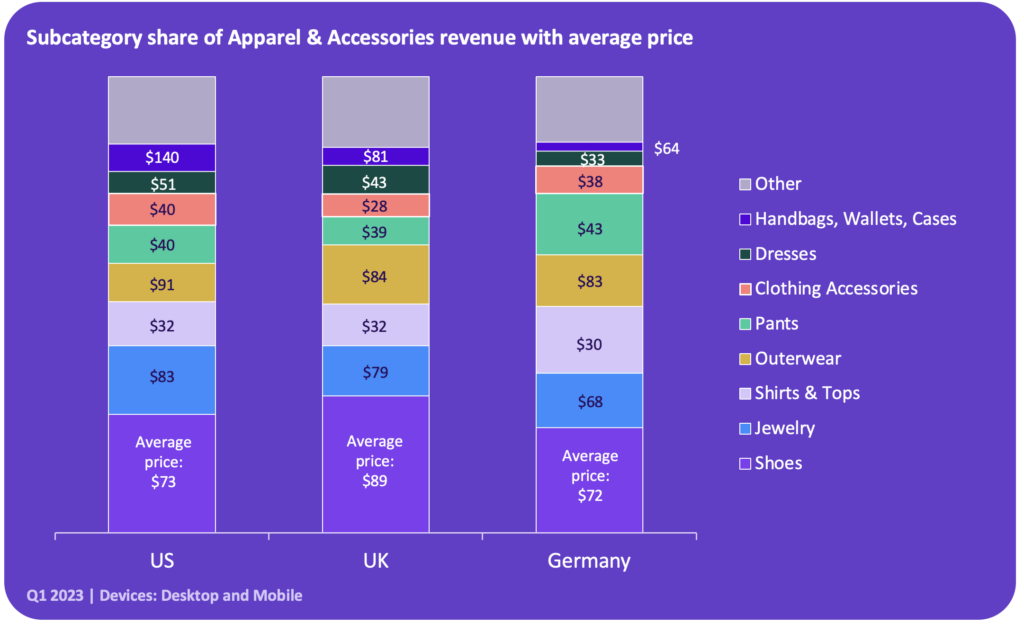
Shoes are the industry’s top-selling subcategory

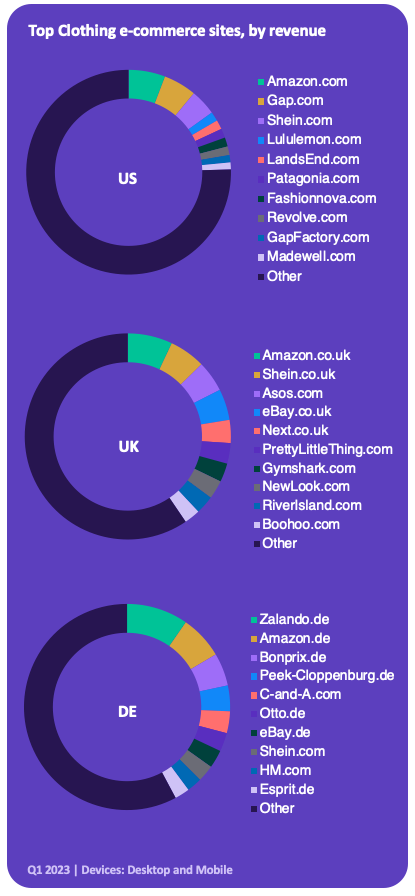
According to Grips, Shoes account for the largest share of e-commerce revenue for Apparel & Accessories products in the US, UK and Germany, representing between 23 percent and 30 percent of online Apparel & Accessories sales. The average price for Shoes in the UK, was the highest at $89 while in the US and Germany prices were in the low- to mid-seventies range.

In the US, Jewelry accounted for the second greatest share of revenue. Colder average climates pushed other categories up in the UK and Germany. For instance, Outerwear was the second highest grossing subcategory in the UK while Shirts & Tops was runner-up in Germany. Germany also saw a disproportionately high share of revenue to Pants. Of the top major categories, Handbags, Wallets and Cases came in last in the UK and in Germany. Americans, meanwhile, Handbags’ share of wallet in the US was at least 50 percent higher beating out Dresses.

Seasonally speaking, Outwear accounted for a greater share during colder months while Swimwear, Sunglasses, et al accounted for a greater share during warmer/sunnier months. However, there were some interesting trends when breaking the data down further. For instance, Coats & Jackets saw share of wallet peak in November while winter accessories like scarves, gloves, etc. peaked in January indicating consumers had more forethought to buy coats ahead of colder weather but still had a need to supplement or even replace accessories as winter wore on.

Subcategory share of Apparel & Accessories revenue with average price

Likewise, Swimwear accounted for the lowest share of wallet in November but saw share grow immediately after the holidays as consumers began planning Spring travel. Shorts saw a similar trend, but didn’t see sales start to increase again until March suggesting that consumers anticipated needing a new bathing suit earlier than they realized they also needed shorts.

Understanding regional and seasonal differences in sales like these will help brands better plan promotions and assortment to maximize sales.

Revenue by product category

Amazon is a top Clothing retailer in all countries

Looking at the market share of online Apparel & Accessories sales, Grips reports that Amazon is either the top or second highest ranking retailer in the US, UK and Germany with for no less than six percent of online Apparel & Accessories revenue in Q1 2023.Top Clothing e-commerce sites, by revenue

In the US, Gap.com still holds a narrow lead over Shein when it comes to Clothing revenue, but that may not last long. In fact, Shein has already jumped into second place for Apparel & Accessories overall, which includes Shoes and other subcategories. Shein already takes second place in the UK with six percent of Clothing sales, just behind Amazon’s seven percent. Shein is still in the top 10 in Germany, but not yet a contender for a top spot accounting for just three percent of Clothing revenue.

Regional brands are still important though for consumers though. In the US, Canadian-owned Lululemon ranks fourth and Lands End comes in fifth. Meanwhile, in the UK, Asos and Next are in the top five. Local brands are most popular in Germany where Zalando is the top Clothing retailer with 10 percent of Q1 sales. In fact, Amazon is the only non-German-owned retailer to appear in the top five.

Fastest Growing Clothing Retailers

Azazie more than doubles market share in Q1 2023

Staying on top of your competition means not only knowing who your competition is today, but knowing who it will be tomorrow. Grips shows marketers month-by-month the share of category revenue owned by tens of thousands of e-commerce domains. On this page, we’ll take a look at the fastest growing Clothing sites based on their change in market share between Q4 2022 and Q1 2023.

In the United States, special-occasion dress site Azazie.com saw it’s share of e-commerce Clothing sales increase by 149% in Q1. While Azazie still captured just 0.4 percent of online Clothing sales, that was up from 0.2 percent in Q4. This was likely driven by the surge of shoppers seeking out prom dresses in late winter/early spring.

Fastest growing Clothing sites, by QoQ change in market share

The second and third fastest growing sites in the United States is a case study in contradiction. On one hand, we see reinvented thrift site ThredUp expanding market share by a relative 75 percent. On the other, we have fast-fashion H&M growing share by 50 percent suggesting that Gen Z shoppers are not entirely abandoning disposable fashion in the name of sustainability. H&M was also among the fastest growing sites in Germany.

In Germany and in the UK, one of the original fast-fashion sites, Zara, was among the fastest growing expanding market share by a relative 50 percent and 69 percent, respectively.

Net-a-Porter, which offers same day delivery of luxury fashion in London and next day delivery in the rest of the UK grew market share by 51 percent QoQ and accounting for 0.4 percent of e-commerce clothing sales in the UK during Q1.

Nike.com, which recently accounted plans to expand their wholesaler network saw its Clothing market share increase by 49 percent in the UK. Nike saw similar growth in the US and Germany, but not enough to make it into the to three in those countries.

Top Shoe retailers

Nike is a top Shoe retailer in all countries

Looking at the market share of online Shoe sales, Grips reports that Nike is either the top or second highest ranking retailer in the US, UK and Germany. Nike’s share in the US is just six percent, but in the UK and Germany, Nike.com accounted for 14 percent and 17 percent of every online shoe purchase during Q1, respectively. Aside from Nike, no other shoe brand accounts for enough revenue to place in the top five with the exception of Adidas which ranked fourth in Germany.

Top Shoe e-commerce sites, by revenue

Shein is within striking distance of first place with less than half of a percentage point separating it from Nike in the US. Shein ranks a distant third in Germany but doesn’t appear in the top five at all in the UK.

The top five retailers account for nearly half of all online Shoe sales in the UK and Germany (41 percent and 47 percent, respectively). But in the US, the top five account for less than 20 percent of revenue and no single retailer controlling more than six percent of sales meaning more opportunity for competition in the US and a higher barrier of entry in the other markets.

Top US Shoe retailers by price

Budget footwear accounts for nearly half of units sold

US Shoe sites with an average price below $65 account for just under half of all Shoe units sold online during Q1 2023. However, in terms of revenue, those sites account for just a fifth of the category’s e-commerce revenue. Leading sites in the budget shoe category include Shein, Shoe Carnival and Nordstrom Rack. Shein is, by far, the US site with the lowest average Shoe price coming in at just $19 per pair.

US Shoes market share, by price

At the opposite end of the scale, sites whose average Shoe price is $150 or more account for  15 percent of total revenue but only 4 percent of unit sales. Neiman Marcus operates the leading high-end Shoe site where the average price of a pair of shoes is $348, according to Grips.

In the middle of the pack, sites with average prices between $65 and $150 account for 47 percent of unit sales and 65 percent of revenue. DSW leads the pack among sites with average prices between $65 and $100 while Nike.com ranks first among sites with prices between $100 and $150.

Top US Shoe sites, by average price ranked by share of total category revenue

A behind the scenes look at Shein

Ultra Fast-Fashion is on the move

Grips reports that Shein.com brought in an estimated $618 million in revenue in the US in Q1 2023. That’s an increase of 35 percent over Q4 2022. During the same time, e-commerce sales for the overall Apparel & Accessories category (a category which represents nearly two-thirds of Shein.com’s overall sales) fell by a not unexpected 14 percent, as a result of seasonal sales patterns.

Shein’s growth as the category declined resulted in the fast fashion retailer expanding its share of US Apparel & Accessories sales by a relative 45 percent quarter-over-quarter and propelled Shein past Gap.com to become America’s second top-ranking e-commerce Apparel & Accessories site, after Amazon. Furthermore, Shein.com expanded its category share even more in April and May pointing to a strong year for the (allegedly) soon-to-be public company.

Shein.com continues to expand its share of total e-commerce Apparel & Accessories sales in the US.


In addition to Shein’s ability to delivering trending fashions to market in weeks, Shein’s prices are perhaps even more alluring to its core base. In the United States, average prices on Shein.com in Q1 for its top selling categories were at least 65 percent below the category average and at least 30 percent cheaper than Gap.com

The average price for a pair of shoes across over 2,100
e-commerce retailers tracked by Grips was $76. But on Shein.com, shoes sell for an average of just $19. Shein made up for that difference in volume and in Q1 Grips estimates that Shein an estimated 9.7 million pairs of shoes, far ahead of second place Nike.com which moved just 2.6 million pairs, but at a price of $116 each.

Top Shein.com subcategories, by revenue and average price

With all signs pointing to Shein going through an IPO laterthis year, investors need insights like these to make informed decisions and competitors need to see where Shein’s biggest strengths lie in order to stay competitive.


Request a free demo