Track your competitors’
e-commerce performance.

Create dashboards from any e-commerce domain and track their key metrics in real-time.

What is Grips Industry Intelligence?

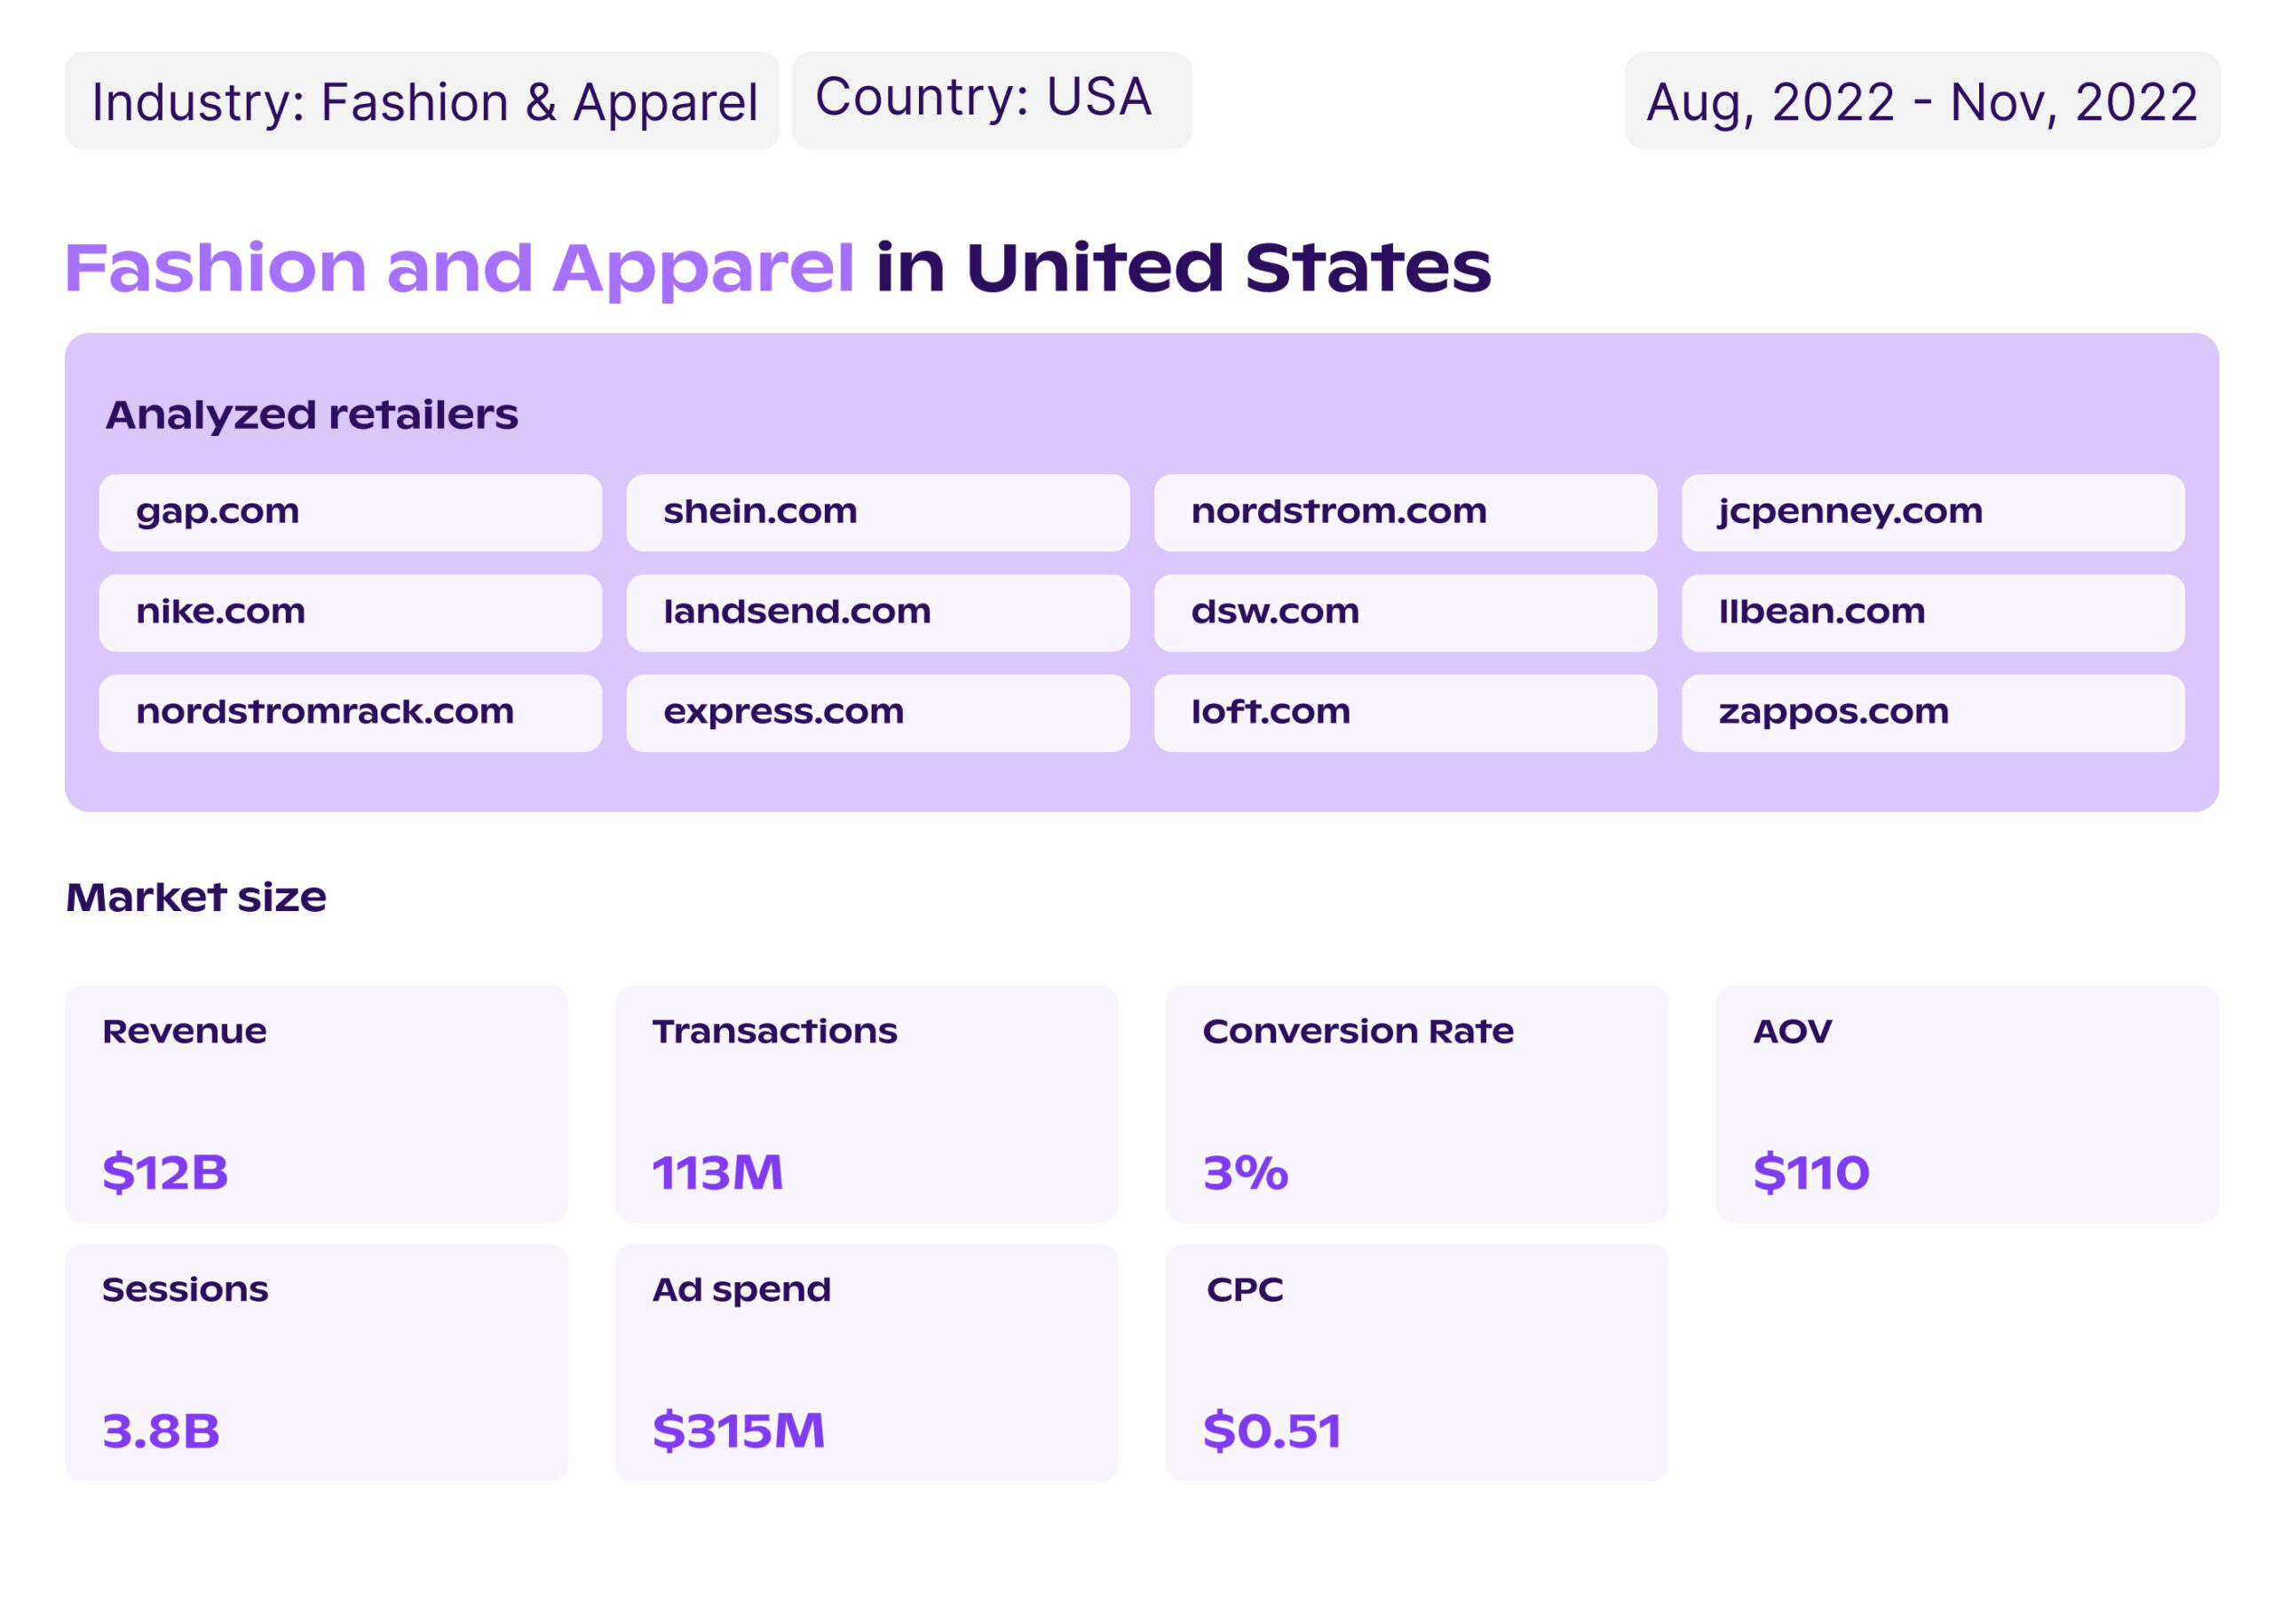
Grips Industry Intelligence maps out the revenues of all relevant retailers in any e-commerce industry. It sheds light on the most important online performance indicators such as Average Order Values (AOVs), Conversion Rates (CRs), and sales across all marketing channels and devices. Use Grips for the most comprehensive and complete insight into e-commerce.

Get a grip on any e-commerce retailer.
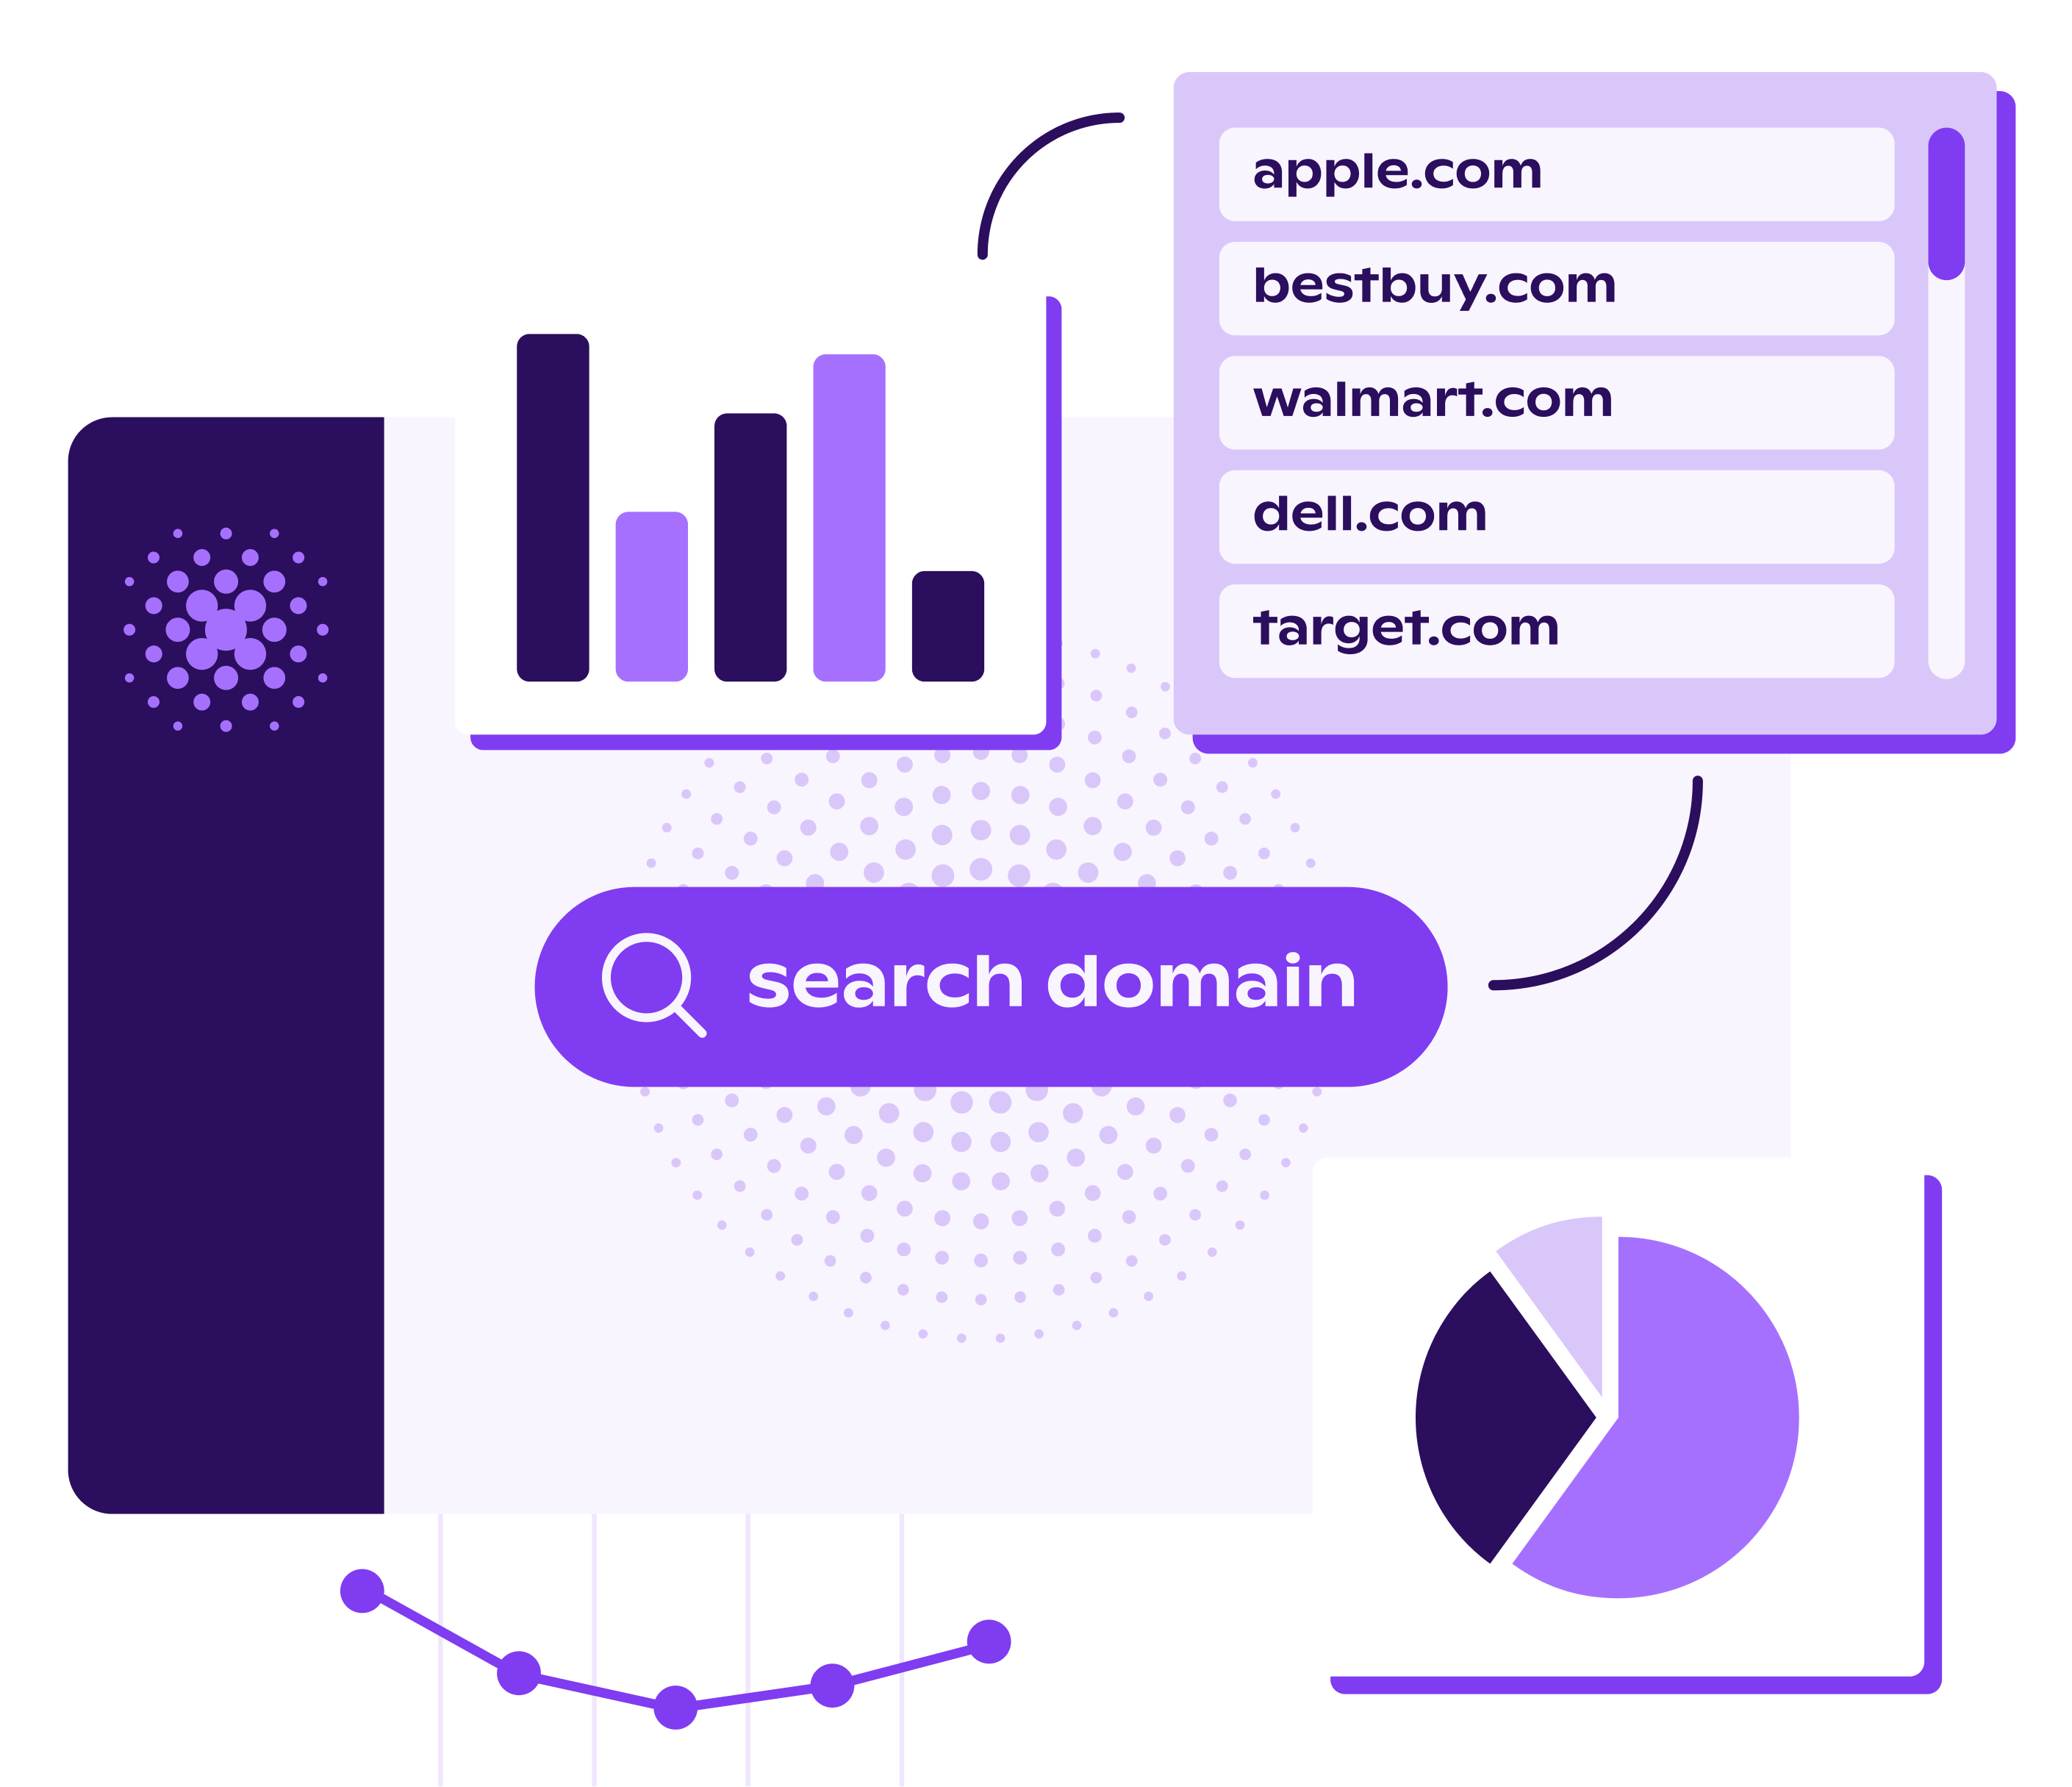
Any eRetailer
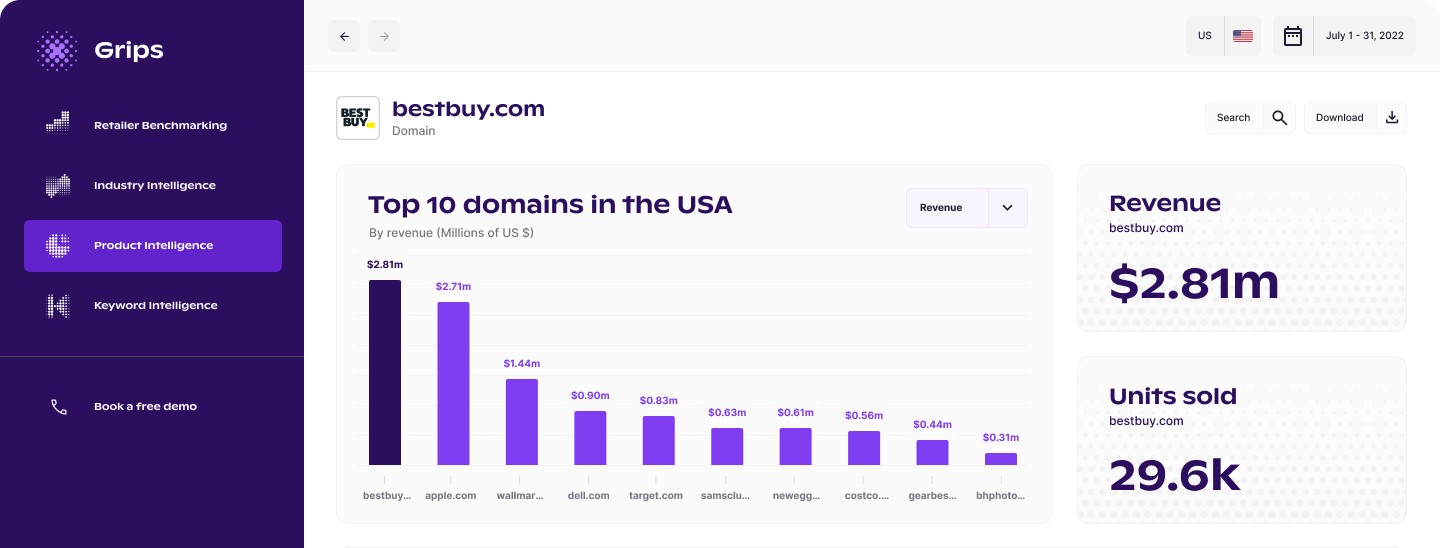
On the shelf >65k top domains or any domain of your choice
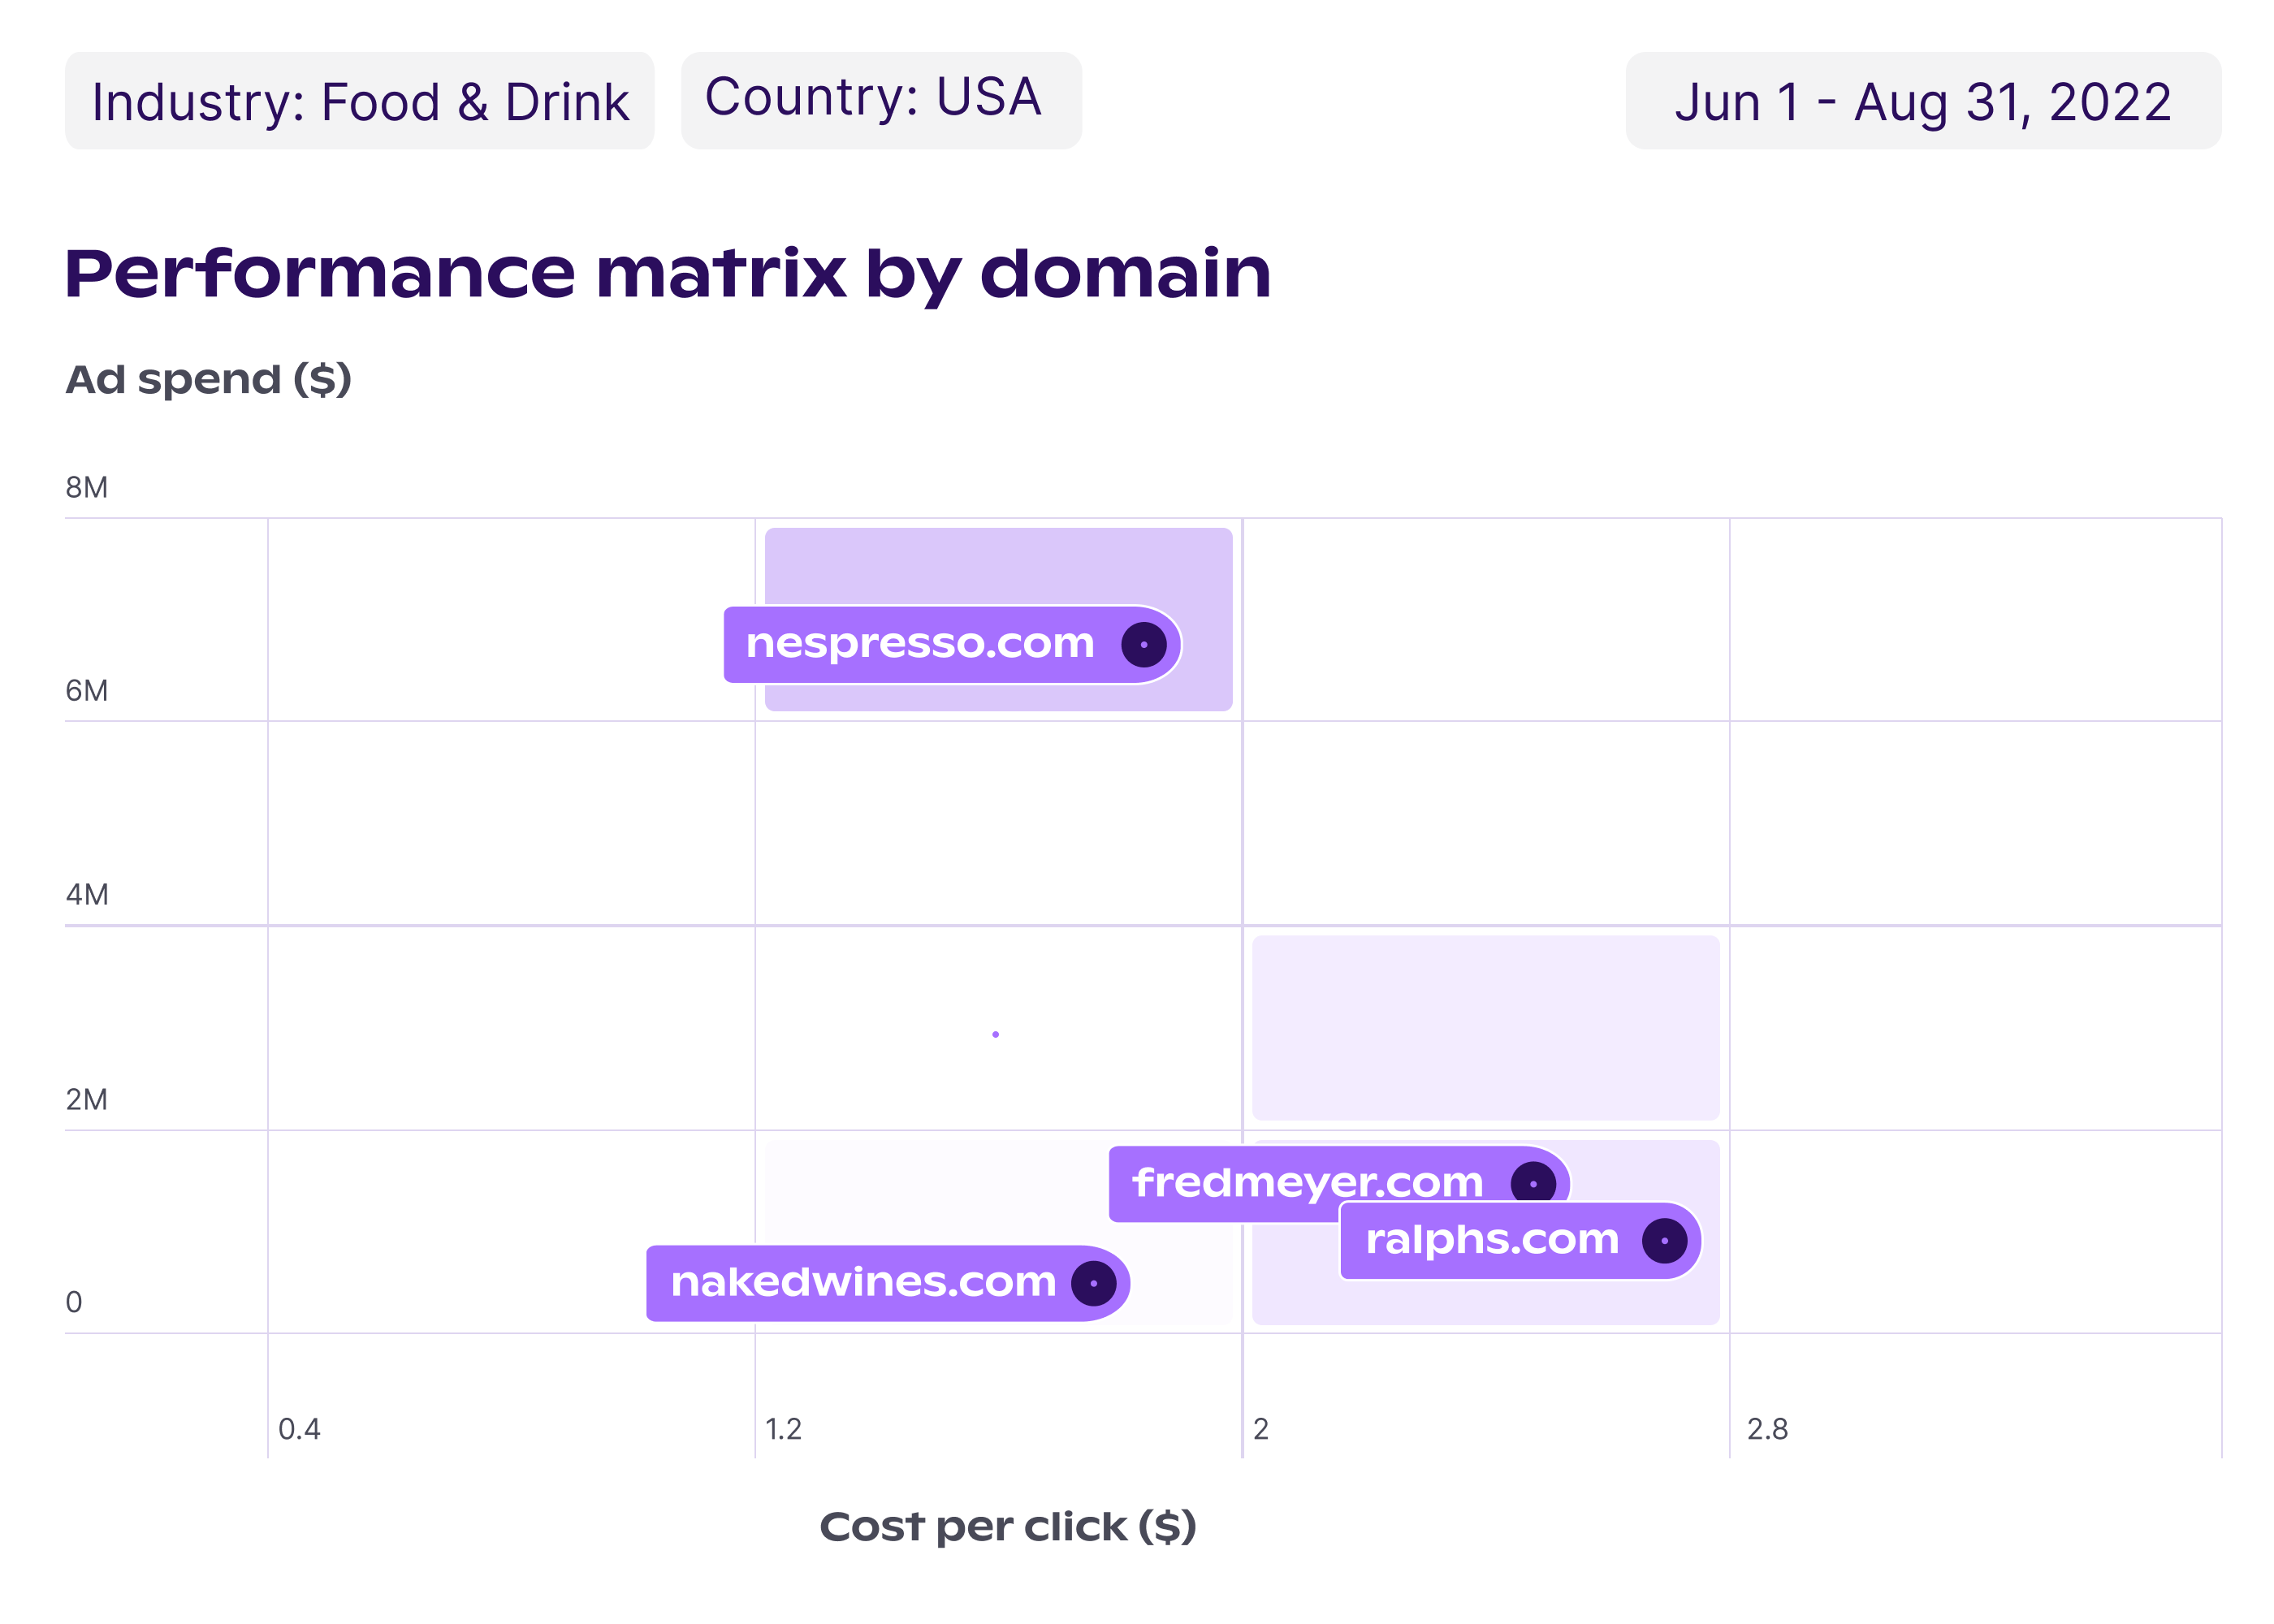
Transaction Data
See revenue, transactions, AOVs, and conversion rates
Global Markets
Explore sales across more than one hundred countries

Competitive e-commerce insights at your fingertips.

retail competitive landscape matrix in consumer electronics in the us
Retailer Mapping

Compare and contrast sales performance

Explore the key metrics (AOVs, CRs, Transactions and Revenue) of your domains of choice or any industry. Our data is available for 65k retailers in over 200 industries.
domain-performance-matrix-google-ads
Google Ads

Optimize your ad spend

Benchmark your Google Ads performance to identify opportunities for improvement. Compare your Ad Spend and CPC performance against selected competitors in a domain-level matrix.
fashion-apparel-market-size
Market Sizing

Measure industry size and performance over time

Find the most relevant metrics of a strategic group of competitors or of any industry in seconds. Explore the market’s total size, sales, conversion rates, and more.
revenue trend in consumer electronics in the us
Market share

Explore the KPIs of any market

Select an industry or build a panel with a strategic group of competitors and calculate your relative market share (your revenue/ sum of groups’ revenue).

Your e-commerce mission now has a guide.

Start for free — upgrade anytime.
grips platform screenshot - bestbuy.com revenue and units sold