article

Top KPI Metrics E-Commerce Leaders Should Track

Tracking the right KPIs is crucial for e-commerce success. From Revenue Growth to Customer Lifetime Value (CLV), understanding these key metrics—and how they compare to competitors—can provide valuable insights to optimize performance and drive growth.
Bushra Raja
5 min read
10 October 2024

Overview

For e-commerce leaders, tracking the right Key Performance Indicators (KPIs) is essential to ensure sustainable growth and market relevance. For e-commerce leaders, defining KPIs correctly is vital for monitoring business health and making data-driven decisions.

These key performance index metrics not only provide a snapshot of internal performance but also offer insights into the broader market and your competitors’ strengths and weaknesses. Without the right performance indicators, e-commerce businesses risk falling behind. Below, we’ll dive into the most critical key performance indicators every e-commerce leader should track and why integrating competitive intelligence into your KPI tracking is crucial.

Revenue Growth Rate

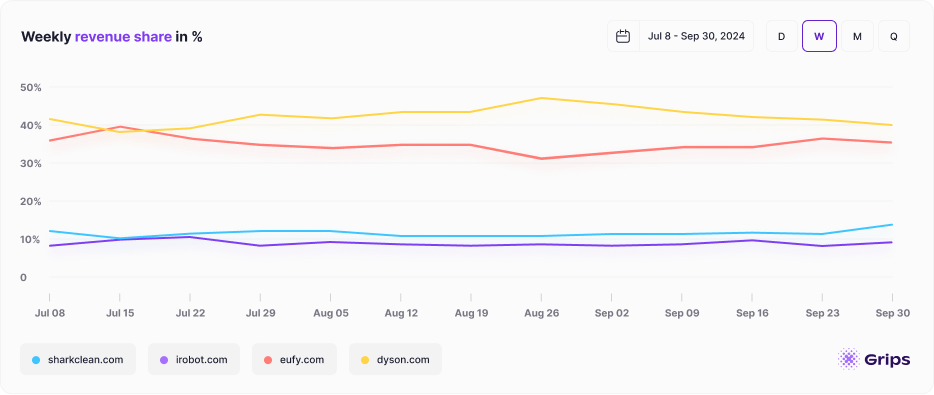
Revenue growth is one of the most direct key performance metrics examples that reflect business success. Tracking your revenue on a quarterly, monthly and daily basis helps you understand how well you are scaling. The ability to benchmark your growth against competitors using transactional and revenue comparisons within Grips can offer deeper insights into where you stand in the market.

Tracking revenue growth is essential, but understanding where you stand compared to competitors can provide context. If you’re growing slower than others, for example, it’s time to rethink your strategy.

Customer Lifetime Value (CLV) and Customer Acquisition Cost (CAC)

Your Customer Lifetime Value (CLV)—also known as client lifetime value or consumer lifetime value—is a core indicator of long-term profitability. Paired with Customer Acquisition Cost (CAC), this KPI gives you insight into whether you’re acquiring customers at a sustainable rate. Calculating CLV helps determine the value each customer brings over their lifetime, and CAC measures how much you spend to acquire them. Ideally, your CLV should be several times higher than your CAC for profitability.
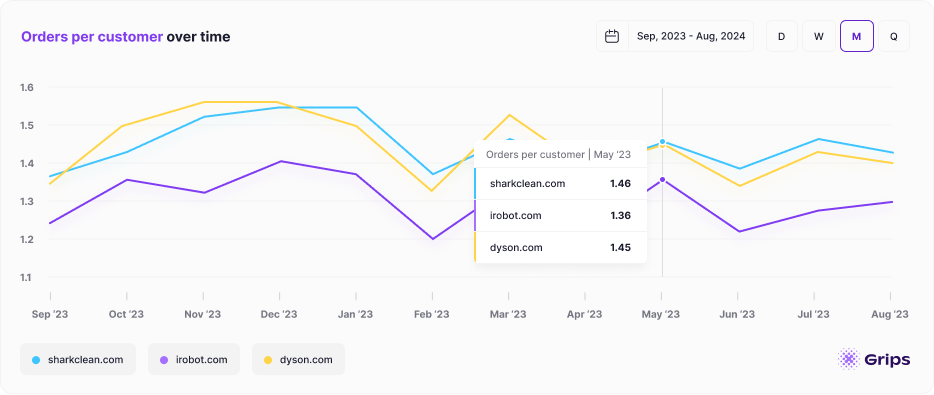
Another way to measure Customer Lifetime Value (CLV) is by tracking Repeat Purchases per Customer. This metric helps businesses assess customer loyalty by revealing how often customers return to make additional purchases. By analyzing this data, Grips clients can gain insights into customer retention patterns. For example, a higher Repeat Purchases value suggests stronger loyalty, giving you a competitive edge. Comparing this metric against competitors can reveal where their customers demonstrate higher engagement and loyalty, offering a valuable opportunity to refine retention strategies.
Tracking these KPIs together provides clarity on the cost-effectiveness of your acquisition strategies. Competitive benchmarking, especially around lifetime value (LTV) marketing efforts, reveals how your CAC compares to the industry standard. If competitors are spending less and gaining more, you may need to adjust your marketing efforts.
Conversion Rate

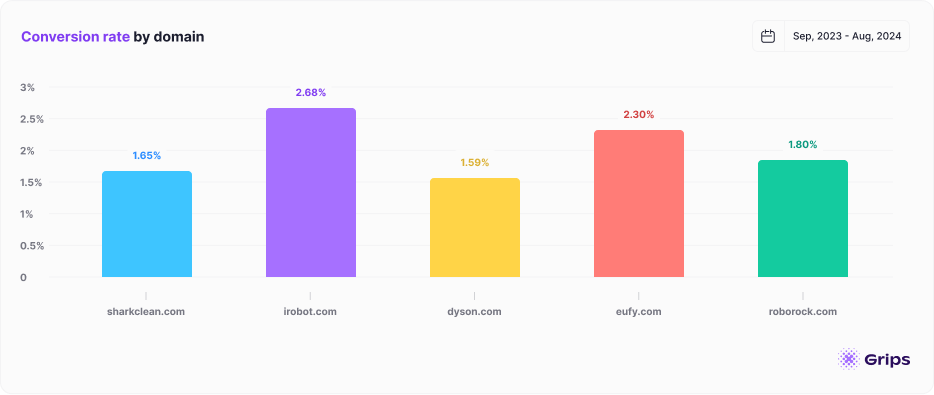
Your conversion rate is the percentage of visitors who complete a purchase. While driving traffic is essential, it’s the conversion rate that ultimately determines success. Grips Intelligence shows clients how their conversion rate compares to others in the market which gives a starting point for adjusting strategy. For example, if a competitor with similar traffic levels has a higher conversion rate, it’s an indicator that they may have a better customer experience or stronger marketing incentives in place.

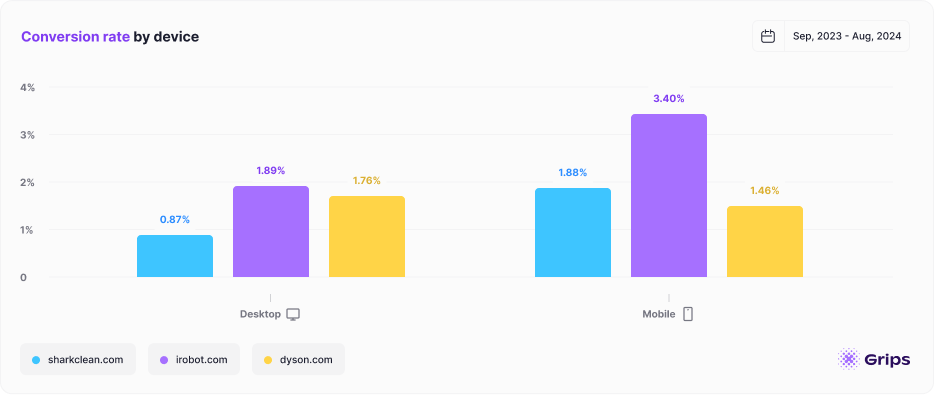
Don’t forget to look at your conversion rate across different devices. While mobile is increasingly accounting for a majority of online sales, conversion rates are typically lower and at a lower average order value too.

Average Order Value (AOV)

Average Order Value (AOV) measures the average amount a customer spends per transaction on your site, offering insights into the type of products being sold, whether they’re premium or big-ticket items. Generally, sites with a higher AOV tend to have lower conversion rates, as more expensive items are purchased less frequently compared to lower-cost products.

When analyzing AOV, it’s important to balance pricing strategies carefully. Increasing prices can lead to a drop in conversion rates, while lowering AOV may reduce overall profitability. By comparing AOV with competitors using Grips, you can better understand how your competitors strike the right balance between AOV and conversion rate. Analyzing this relationship can serve as a useful guide before making any price adjustments.

Churn Rate

The churn rate measures the percentage of customers who stop doing business with your company during a given time frame. High churn negatively impacts MRR and ARR, making it a critical success indicator example for e-commerce businesses that rely on repeat customers or subscription models.

Tracking your churn alongside NPS (Net Promoter Score), which measures customer satisfaction and loyalty, provides clarity on customer retention. High churn and low NPS rating indicate an issue with your customer experience or product quality that needs immediate attention.

Net Promoter Score (NPS)

Your NPS score is a measure of customer satisfaction. Customers rate how likely they are to recommend your brand on a scale from 0 to 10, and your NPS rating is calculated based on the percentage of promoters minus the percentage of detractors. A high NPS means customers are likely to recommend your products or services, while a low NPS promoter score signals dissatisfaction.

Comparing your NPS to industry averages can reveal whether your brand resonates more or less with customers than competitors. High NPS generally correlates with strong customer loyalty, which improves lifetime value (LTV) and reduces churn.

Inventory Turnover Rate

Inventory turns and the inventory turn ratio reflect how fast products are sold and replaced. Low turnover means products are sitting unsold, tying up capital and increasing storage costs.

Tracking your inventory turnover ratio relative to competitors using Grips reveals whether you’re overstocking or underpricing your products. High inventory turnover often correlates with efficient demand planning and better marketing execution.

The Competitive Advantage of KPI Benchmarking

Tracking KPIs is essential for understanding the health of your e-commerce business, but you gain even more value when these key performance areas are measured against competitors. Competitive intelligence gives context to your performance, allowing you to see where you’re leading or lagging. By regularly monitoring competitor benchmarks, whether in revenue, conversion rate, or CAC cost, you can adjust strategies in real-time to stay competitive.

Neglecting to track and compare these key performance indicators examples leaves blind spots in your strategy and can result in missed opportunities or decreased market share. Integrating competitive insights into your KPI’s gives you a sharper understanding of where you stand and where to focus your resources.

Leverage Grips for Benchmarking your KPIs

Grips delivers key performance metrics for over 65,000 retailers and D2C sites. Schedule a call with us to explore your competitors’ data in detail and uncover where your KPIs might be falling short, so you can take action and stay ahead in the market.