article

Top Beauty & Cosmetics digital companies to watch: Free read

Read this exclusive report revealing competitive intelligence on the Beauty & Cosmetics category in the US.
John Fetto
12 min read
10 June 2024

Introduction

Top Beauty & Cosmetics sites to watch

In the dynamic $12 billion beauty and cosmetics e-commerce category in the US, certain digital companies are setting the pace, redefining how consumers approach beauty and self-care. This page is dedicated to spotlighting the top digital companies to watch in this vibrant sector. By analyzing critical metrics like e-commerce revenue, successful promotions, top marketing channels and core demographics, we offer an unparalleled glimpse into the market’s current leaders and emerging trends.

From innovative product lines to strategic marketing approaches, these companies are not just riding the wave of digital transformation; they are creating it. Whether through groundbreaking product launches or savvy digital marketing campaigns, the insights provided reflect a sector that’s not just growing but thriving in its ability to meet and exceed consumer expectations. For industry professionals and beauty enthusiasts alike, this report is a compass pointing towards the future of beauty and cosmetics e-commerce.

SummerFridays.com

summerfridays.com beauty and cosmetics companies to watch

Summer Fridays caters to skincare needs by providing a range of vegan and cruelty-free products. Their selection includes cleansers, moisturizers, masks and more, formulated for a luxurious at-home spa experience.

KPIs
March, 2023 – February, 2024 US vs year prior

summerfridays.com e-commerce KPIs

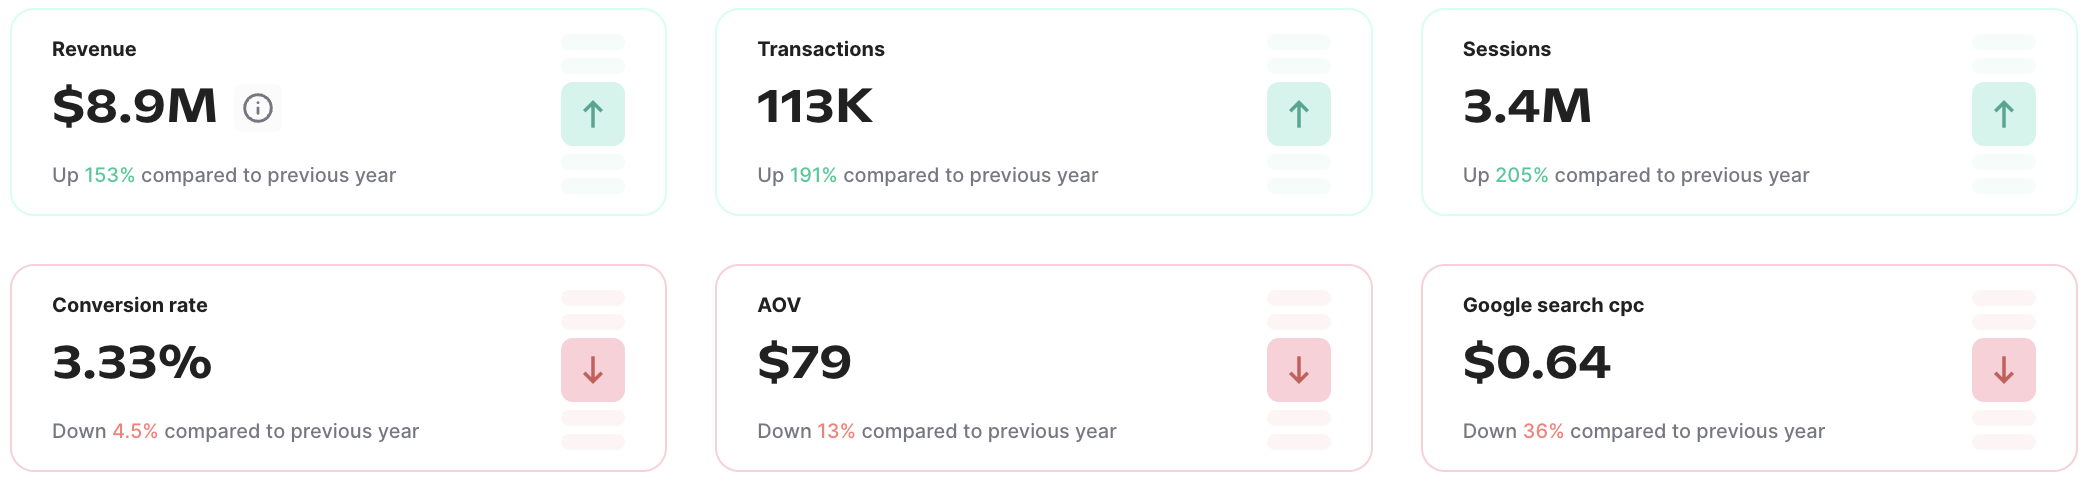
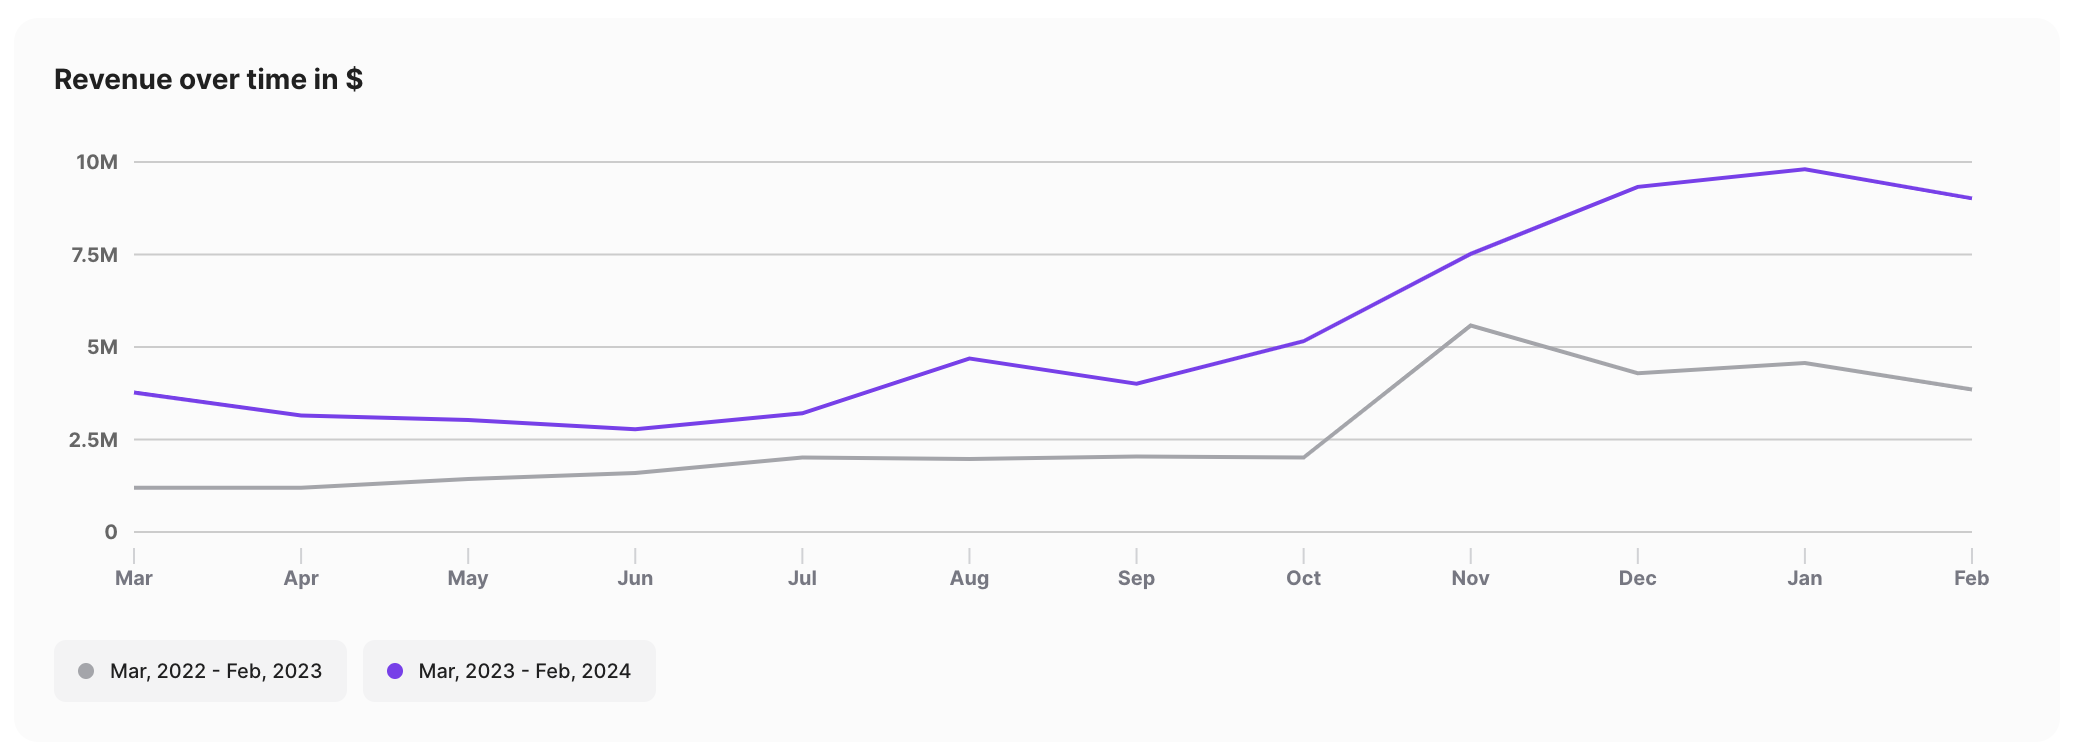
Grips data reveals impressive growth for SummerFridays.com in the US in 2023 and into the start of 2024. Revenue surged 153% to $8.9 million, fuelled by a doubling of website sessions. 

However, Grips’ data showed a slight dip in some customer acquisition metrics. For instance, conversion rate dipped to 3.3% from 3.5%, and the average order value (AOV) fell to $79 from $91. 

Monthly Revenue
March, 2023 – February, 2024 US vs year prior

summerfridays.com e-commerce monthly revenue

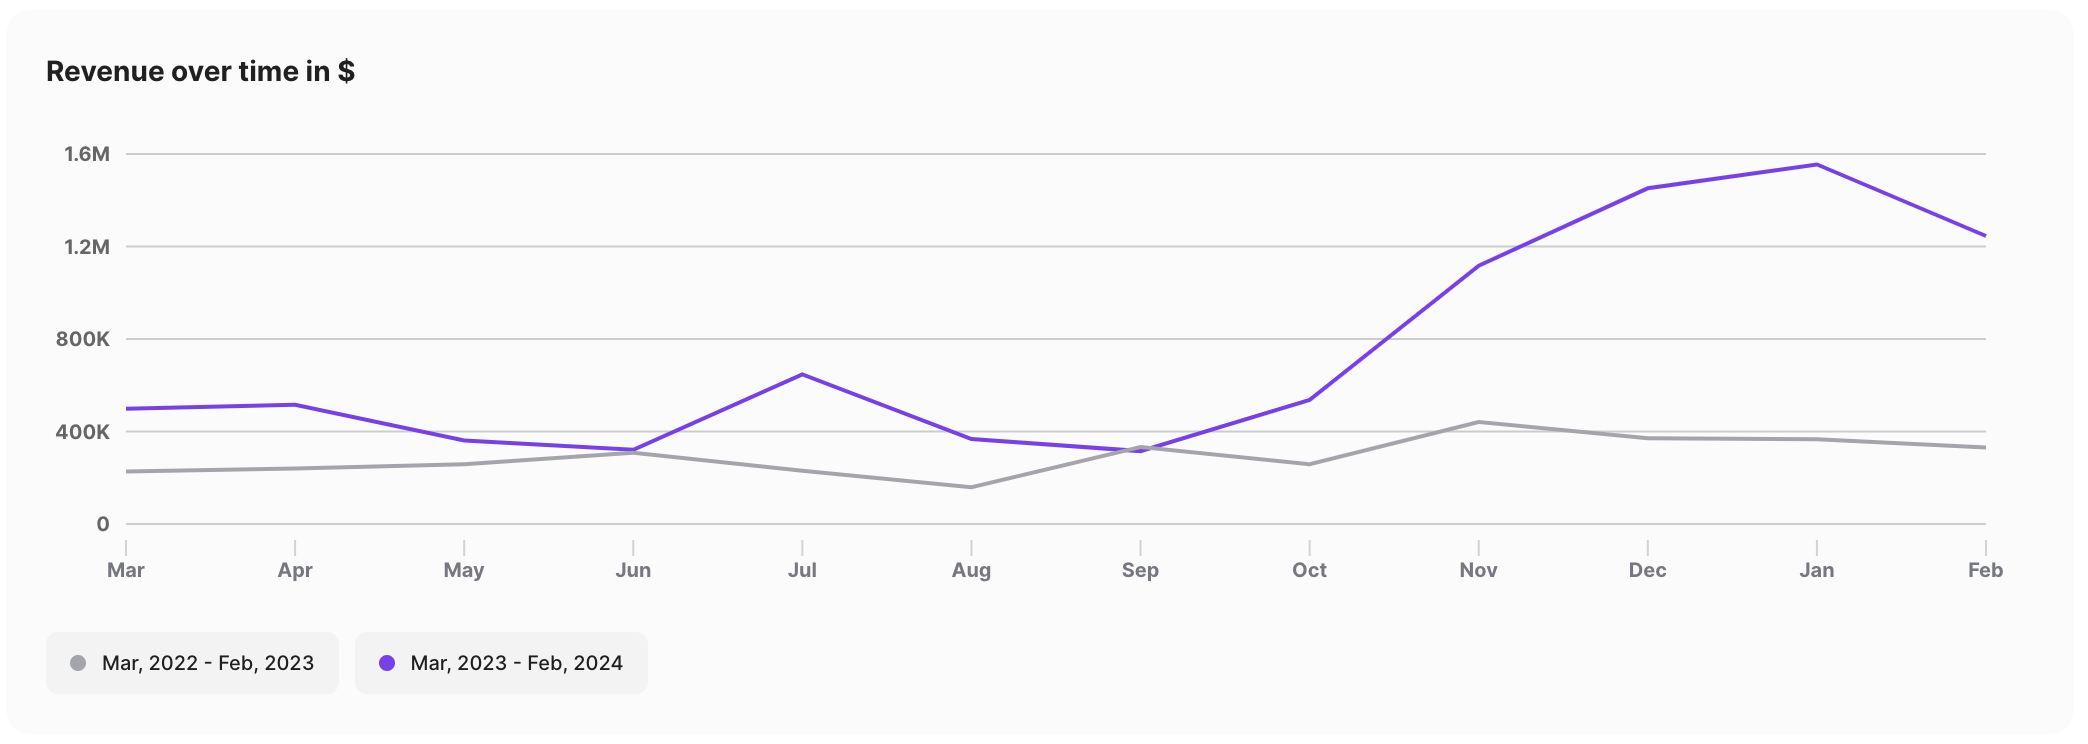
Grips data reveals a strong revenue surge for SummerFridays.com starting in October 2023. But sales really took off in December right about the time that their lip balm went viral. The lip balm, which comes in a range of colors and flavors, including birthday cake and iced coffee, generated millions of views on TikTok. 

Competitor Comparison
March, 2023 – February, 2024 US

vegan beauty brands comparison

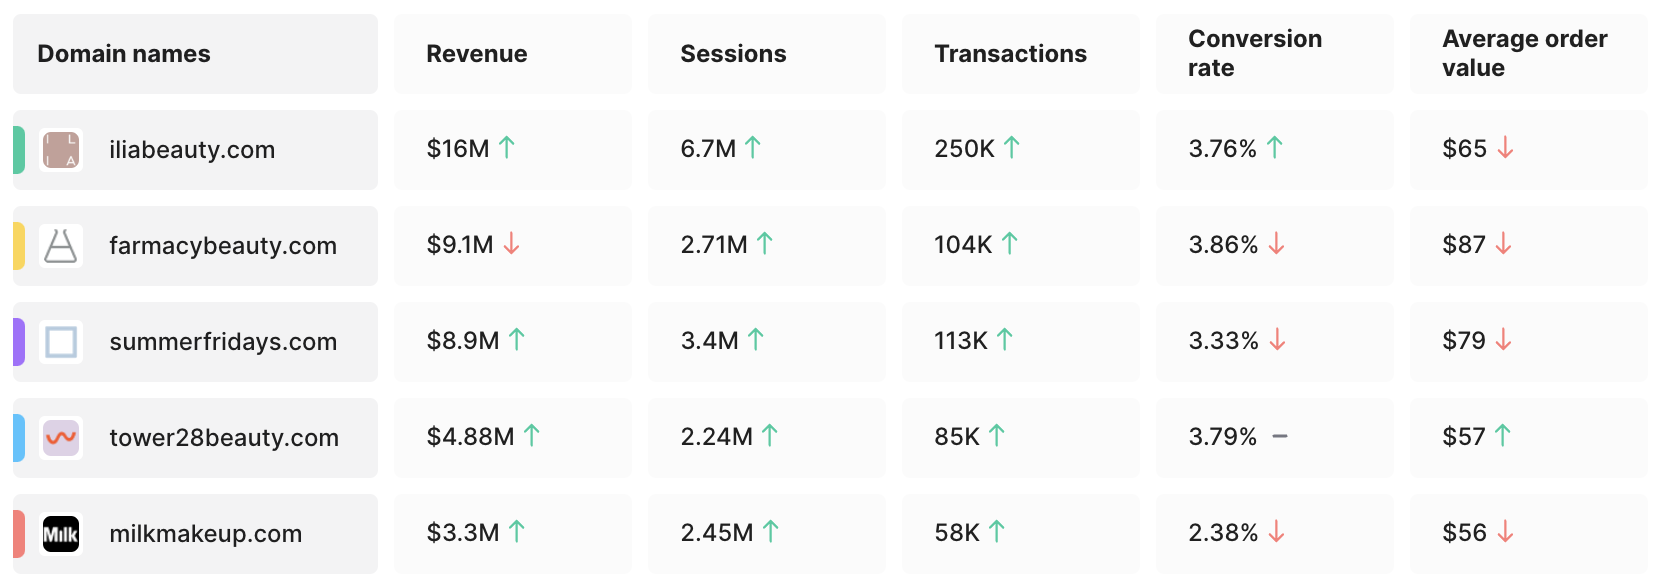
Summer Fridays navigates a tight competitive landscape with other vegan beauty & cosmetics brands. The site boasts a higher AOV compared to competitors, but their conversion rate is lower. While there is generally an inverse correlation between AOV and CVR, Summer Friday may also be seeing a lower conversion rate from the surge in attention from social media which typically convert at lower rates. 

Promotions
November 30, 2023 – May 30, 2024 daily revenue summerfridays.com

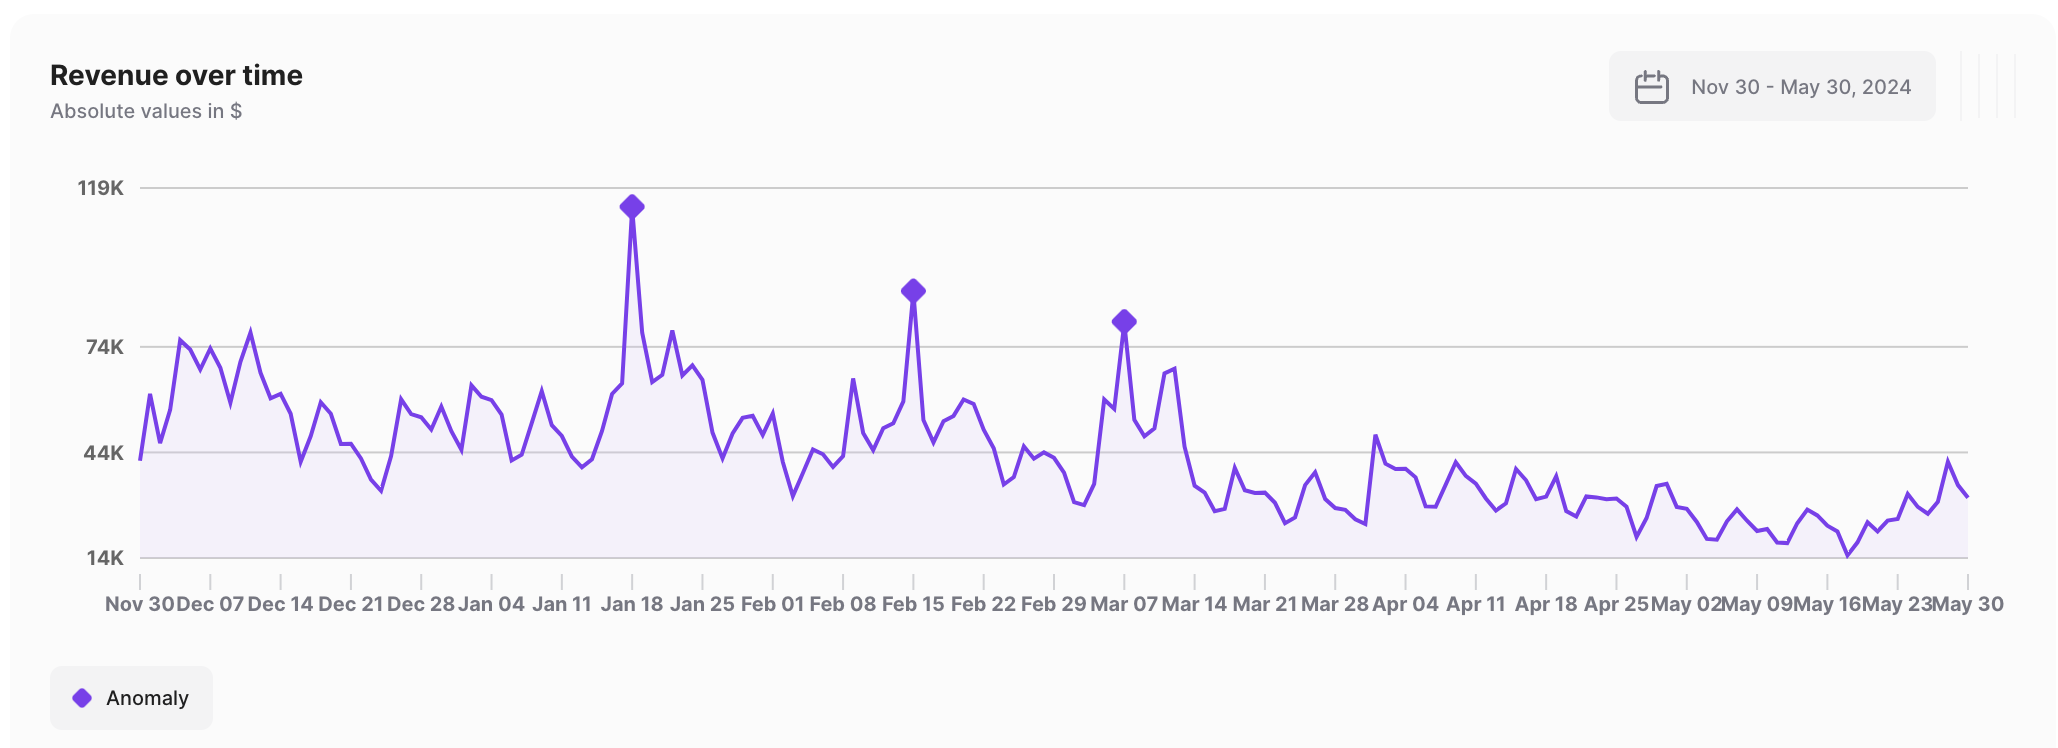
SummerFridays.com daily revenue exceeded Grips expectations three separate times in the past six months. One key date was January 18th when Summer Friday released new Lip Oils generating $116,000 in a single day, more than they generated on Cyber Monday. The spike on February 15th coincided with the release of their birthday cake lip balm and March 7th was their 6th anniversary event.  

Audience strength
March 2023 – February 2024

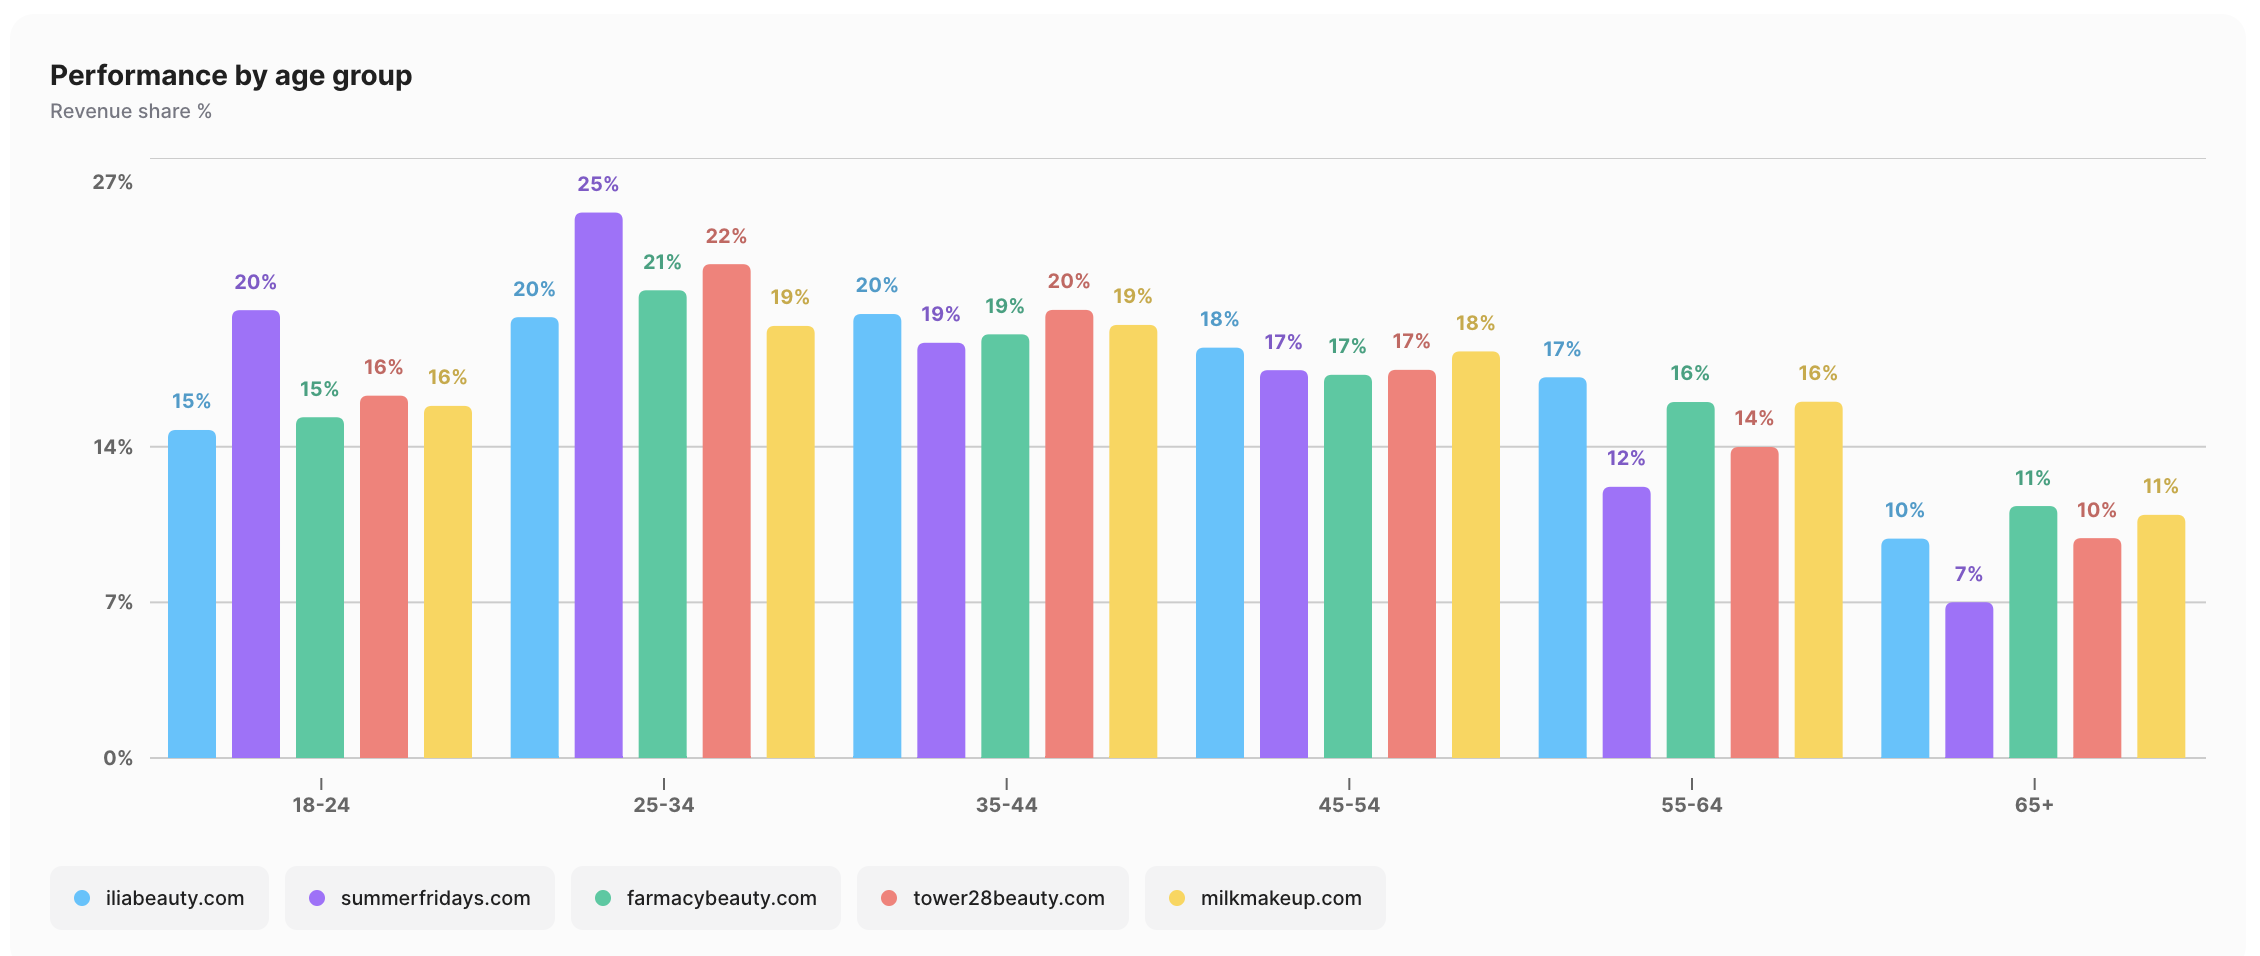
Summer Fridays gets 45% of their revenue from consumers between 18 and 34 years of age, the highest share among the vegan beauty comp set. The youthful skew of their audience no doubt helps the brand attract other young clientele and gives them an opportunity to grow with these young consumers and provide them with an evolving set of products.

revenue share by age summerfridays.com

LauraGeller.com

Laurageller.com top beauty and cosmetics sites to watch

Laura Geller stands out in the Beauty & Cosmetics category by catering to women over 40 with a makeup range that includes foundations, concealers and blushers.

KPIs
March, 2023 – February, 2024 US vs previous year

laurageller.com top KPIsLauraGeller.com‘s sales are on an upward trajectory according to Grips data, with revenue reaching $71 million in the last year. This represents a 106% increase year-over-year. Customer traffic also grew significantly, with sessions up 127% to 33 million and transactions rising 131% to 1.44 million. However, the data also suggests a slight decrease in conversion rate (down to 4.3% from 4.5%) and average order value (AOV) falling by 11%, which is not an uncommon side effect for a company attracting hundreds of thousands of new customers. 

Monthly Revenue
March, 2023 – February, 2024 US vs previous yearlaurageller.com e-commerce monthly revenue 2023

Grips data reveals a robust performance for LauraGeller.com between March 2023 and February 2024, with revenue surging 106% compared to the same period the prior year. Even January 2024, a month often associated with lower sales for some e-commerce retailers, saw Laura Geller reach a record high in revenue ($11 million), only dipping slightly in February, but showing impressive growth compared to the year before.

Competitor Comparison
March, 2023 – February, 2024 US

conversion rate top beauty and cosmetics sites

Laura Geller has not only seen revenue and traffic grow, but conversion rate is on an upward trend as well surpassing many of the top DTC beauty and cosmetics brands. Since October, the conversion rate for LauraGeller.com has risen from 3.6% in the US to 6%. The only other top site to beat Laura Geller is one of our other sites to watch: Il Makiage. 

Marketing Channels
March, 2023 – February, 2024 US 

laurageller.com conversion rate and revenue by digital marketing channel

Looking at LauraGeller.com‘s performance for traffic coming through key digital marketing channels, we can see that Referrals are the top converting channel and that growth in revenue from Referrals has outpaced most other channel. Direct traffic, despite a slightly lower conversion rate, still accounts for the greatest share of revenue and is typically above 50%. This is a good metric to watch to track repeat business. 

Audience
January – March, 2024 US

Laura Geller makes age a central focus to their marketing message and the data confirms that the company is more reliant on consumers between the ages of 35 and 64 than other top beauty and cosmetic sites. In fact, LauraGeller.com gets only 7% of revenue from 18-to 24 year-olds, approximately 50% below industry leaders. 

IlMakiage.com

ilmakiage.com top beauty and cosmetics companies to watch

Ilmakiage.com sells a variety of beauty products ranging from foundation, lipstick, eyeshadow, mascara and more. They strive to offer a wide selection of high-quality and trendy products, catering to diverse customer preferences.

KPIs
March, 2023 – February, 2024 US vs year prior

ilmakiage.com top KPIsIlmakiage.com’s revenue grew 54% YoY, fuelled by a significant increase in website traffic (up 58%). Average order value also saw a nice bump–increasing to $80–though conversion rate did drop about a half point as new customers are slightly less likely to convert than existing ones. 

Monthly Revenue
March, 2023 – February, 2024 US vs year prior

ilmakiage.com monthly revenue
Ilmakiage.com appears to be defying traditional retail patterns. While the December 2023 holiday season predictably brought a surge in revenue, Il Makiage has parlayed that surge into even more sales in the new year. In fact, January and February of 2024 witnessed significant increases compared to the same months in the prior year. This suggests Ilmakiage.com‘s marketing tactics are proving adept at converting holiday shoppers into loyal customers, potentially through strategic post-holiday promotions that keep consumers engaged well beyond the traditional spending period.

Competitor Comparison
March, 2023 – February, 2024 US vs year prior

Ilmakiage.com is a strong and increasingly dominant competitor. MAC and Thrive, for instance, both saw transactions decline year-over-year. In fact, while Mac still technically beat out Il Makiage between the aggregate period of March ’23 through February ’24, revenue for IlMakiage.com was notably higher than MacCosmetics.com in both January and February. And while Charlotte Tilbury saw growth of 17% YoY, that was nothing compared to to Il Makiage. 

Device Comparison
March, 2023 – February, 2024 US vs year prior

ilmakiage.com revenue by device vs beauty and cosmetics competitors
IlMakiage generates more than three-quarters of its revenue via mobile devices. That’s significantly greater than direct competitors. Interestingly, nearly 90% of the traffic to IlMakiage.com is from mobile devices. But desktop traffic is still more than twice as likely to convert. This is true for all leading competitors, but Il Makiage has the top conversion rate regardless of device. On desktop, 9.3% of visits result in a purchase while on mobile, 4.3% of visits convert.

The list doesn't end here

Grips has insights into 50,000 e-commerce sites and 60,000 brands across thousands of product categories big and small. Let us show your the inside secrets of your top competitors. Book a demo today.