US Halloween Spending Index July 30 - October 29
Halloween is creeping up on us, and we’ve got something spooktacular to share!
With Halloween displays taking over store shelves before the back-to-school stock had been carted away, we asked ourselves if spooky season started earlier this year–or if it was a figment of our imagination. After checking the data logs, we can confidently say that Halloween shopping is, in fact, Grips reports that revenue generated from online sales of costumes and accessories is up 8% and candy revenues up 3%, and that’s just in the month of August!
That little tidbit was just enough to whet our candy-obsessed desires to track daily Halloween spending between now and All Hallow’s Eve. So prepare to be bewitched because Grips is conjuring up some real-time magic with our Halloween Spending Index!

Imagine a crystal ball revealing daily spending on Halloween-related goodies, including costumes, decorations, party favors and more. That’s the Grips Intelligence Halloween Index. But it’s not black magic. It’s the real deal. Based on online spending from nine leading retailers specializing in seasonal Halloween merchandise, our Halloween Spending Index will keep you on top of the spooky surge and allow you to benchmark your own performance against the industry norm. That way you’ll know if you’re doing loop-de loops on your broomstick or soo to be relegated to the catacombs along with other zombie brands.
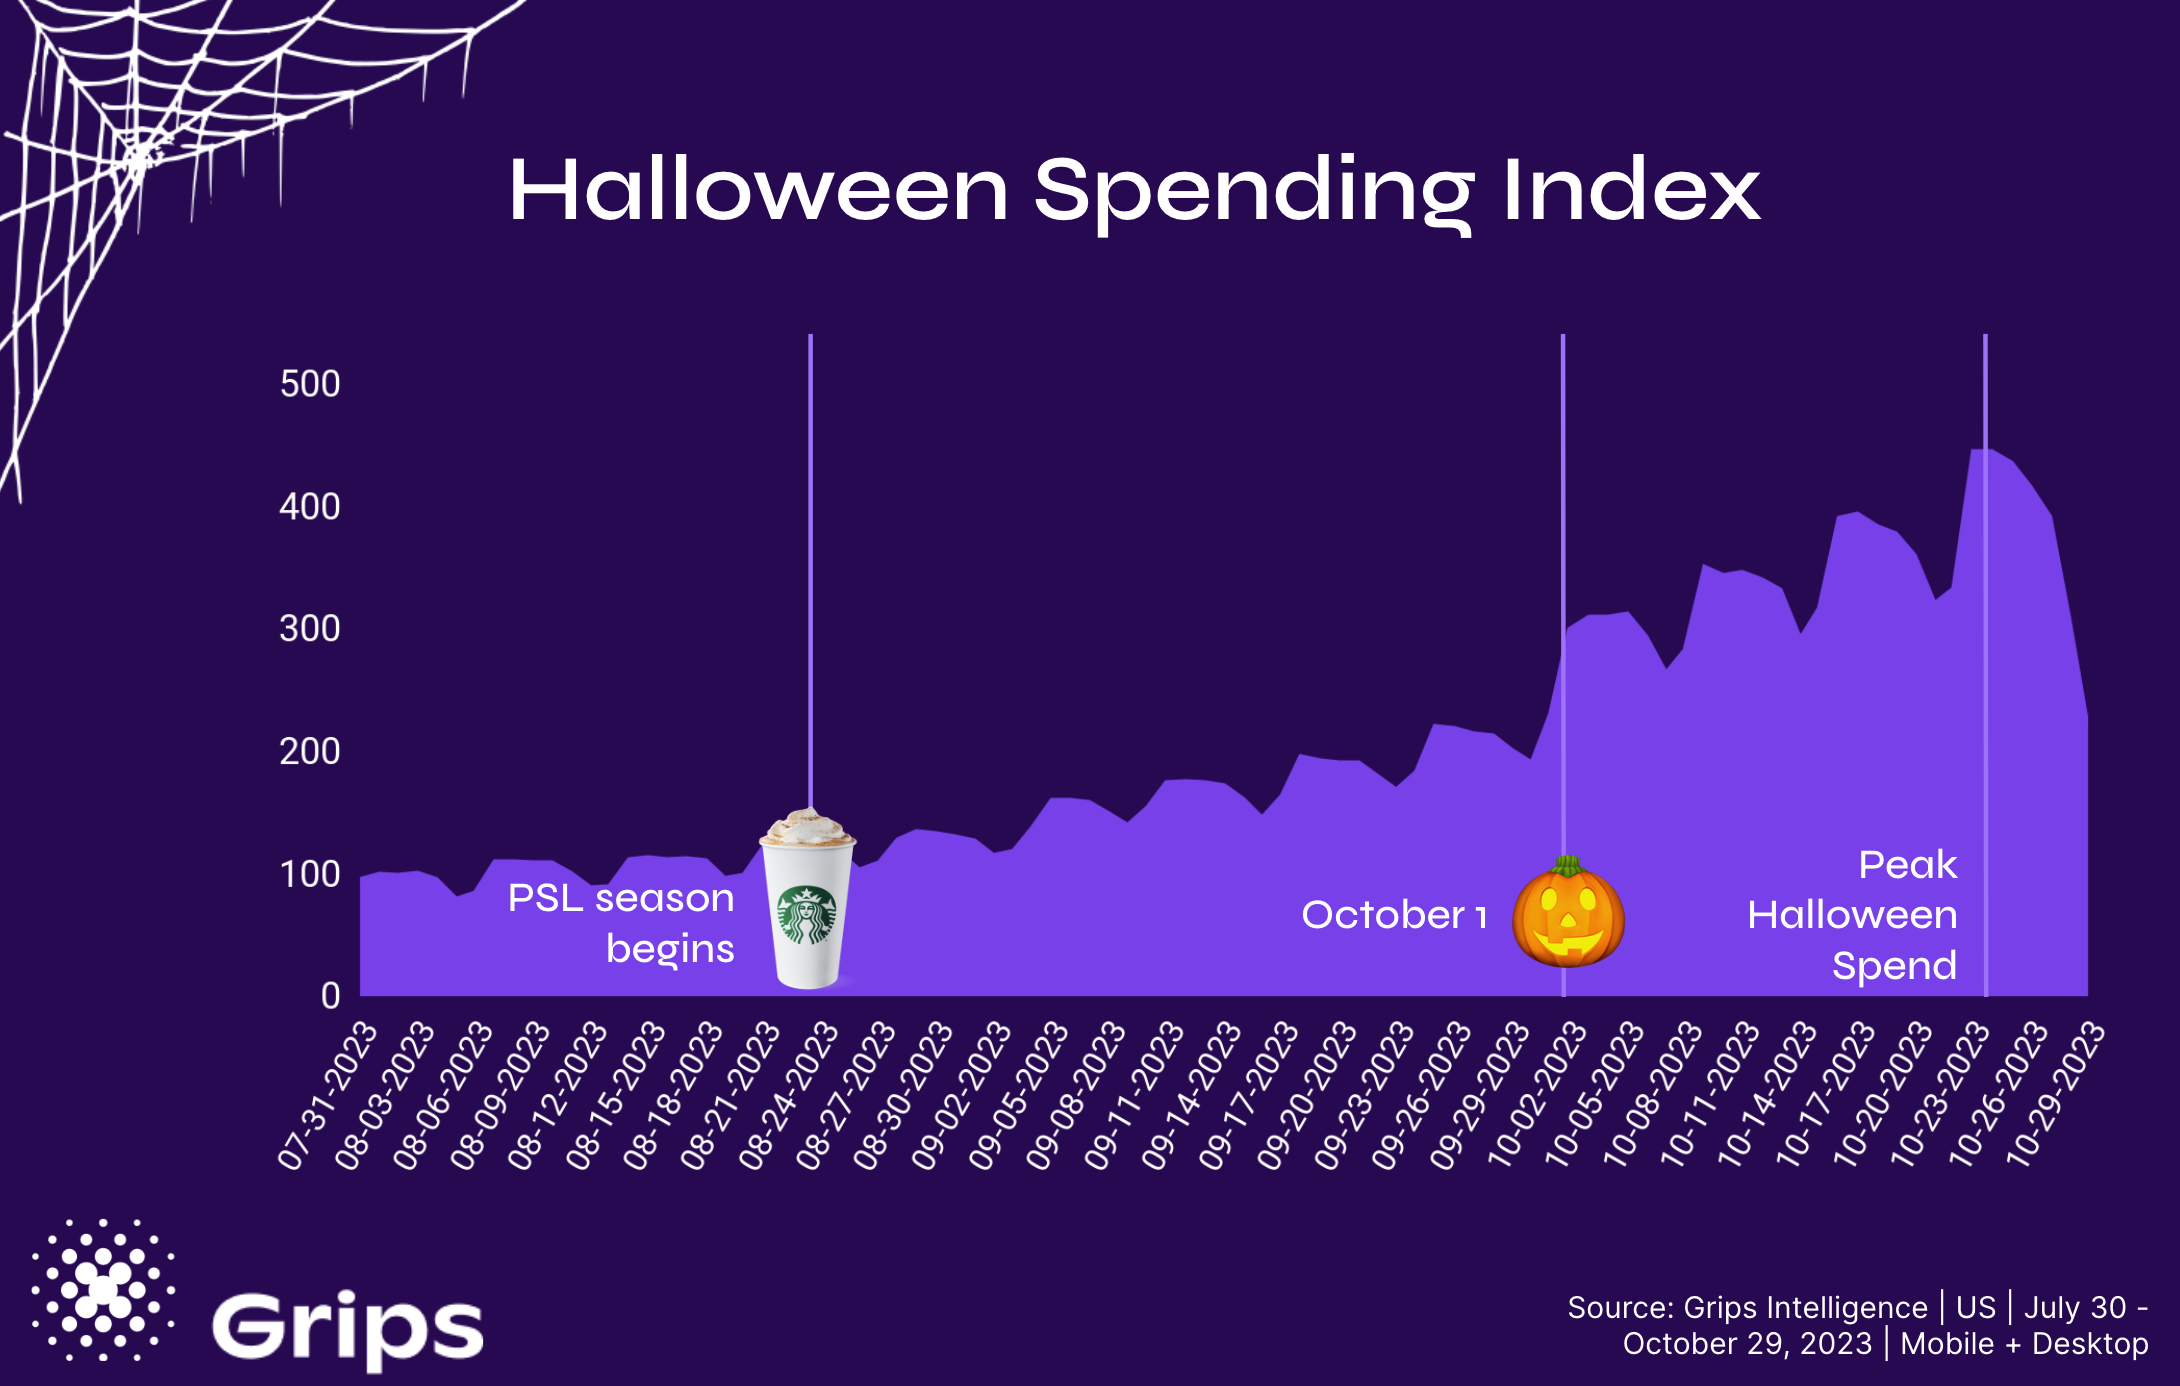
We’ve set our spectrometers to 100 benchmarking the Halloween Spending Index against spending levels observed on Sunday July 30th, a period before which daily and weekly spending levels were relatively uneventful. Any day where our index rises above 100 means the Halloween spirit is in the air, while anything below 100 reveals moments when the spectral energy wanes.
With spending levels gradually rising in early August, American’s opened the door to another plane on August 20th, the last date that our index fell below 100. Ever since, the Grips Halloween Spending Index has transcended earthly limits, ascending higher with each passing day and week.
Our mystical meter suggests a connection between the return of the Halloween spirit and the resurrection of the pumpkin spice latte from Starbucks, which this year occurred on August 24th. In fact, our spectral sensors detected a relative 67% increase in Halloween spending since the return of the PSL. And since July 30th, spending has risen by a spine-tingling 156%.
Grips found that online spending on Halloween-related goodies peaked on October 24th, one full week before Halloween. Spending dropped quickly thereafter with spending on Sunday the 29th just half of what was observed a week prior.
No doubt with Halloween falling on a Tuesday and with most adult celebrations taking place the weekend prior, consumers decided that it was no longer reasonable to expect Halloween items to arrive in time from the 25th onward. With Halloween falling on a Thursday in 2024 and celebrations likely to drag into the following weekend, we may see a later peak in 2024. Retailers can also help extend last minute sales by posting guaranteed delivery dates clearly on their sites as the clock winds down.
While the release of the Pumpkin Spice Latte and the Labor Day holiday both gave Halloween spending a jolt, the biggest spike to date was witnessed the first week of October. The Grips Halloween Spending index jumped from an average of 206 the last week of September to an average of 289 the first week of October, representing an increase in spending on Halloween-related goods of 34% week-over-week. By comparison, the release of the PSL resulted in a 23% spending increase, the second biggest jump of the spooky season.
Consumers continued to up their spooky spending with the index flirting with 400 on October 17th. That means that consumers’ Halloween spending was almost five times higher on October 17th than it was on July 30th. Halloween fever has increased so much that consumers spent more during the first two weeks of October than they did during the last three weeks of September. And there are still two full weeks to go before Halloween.
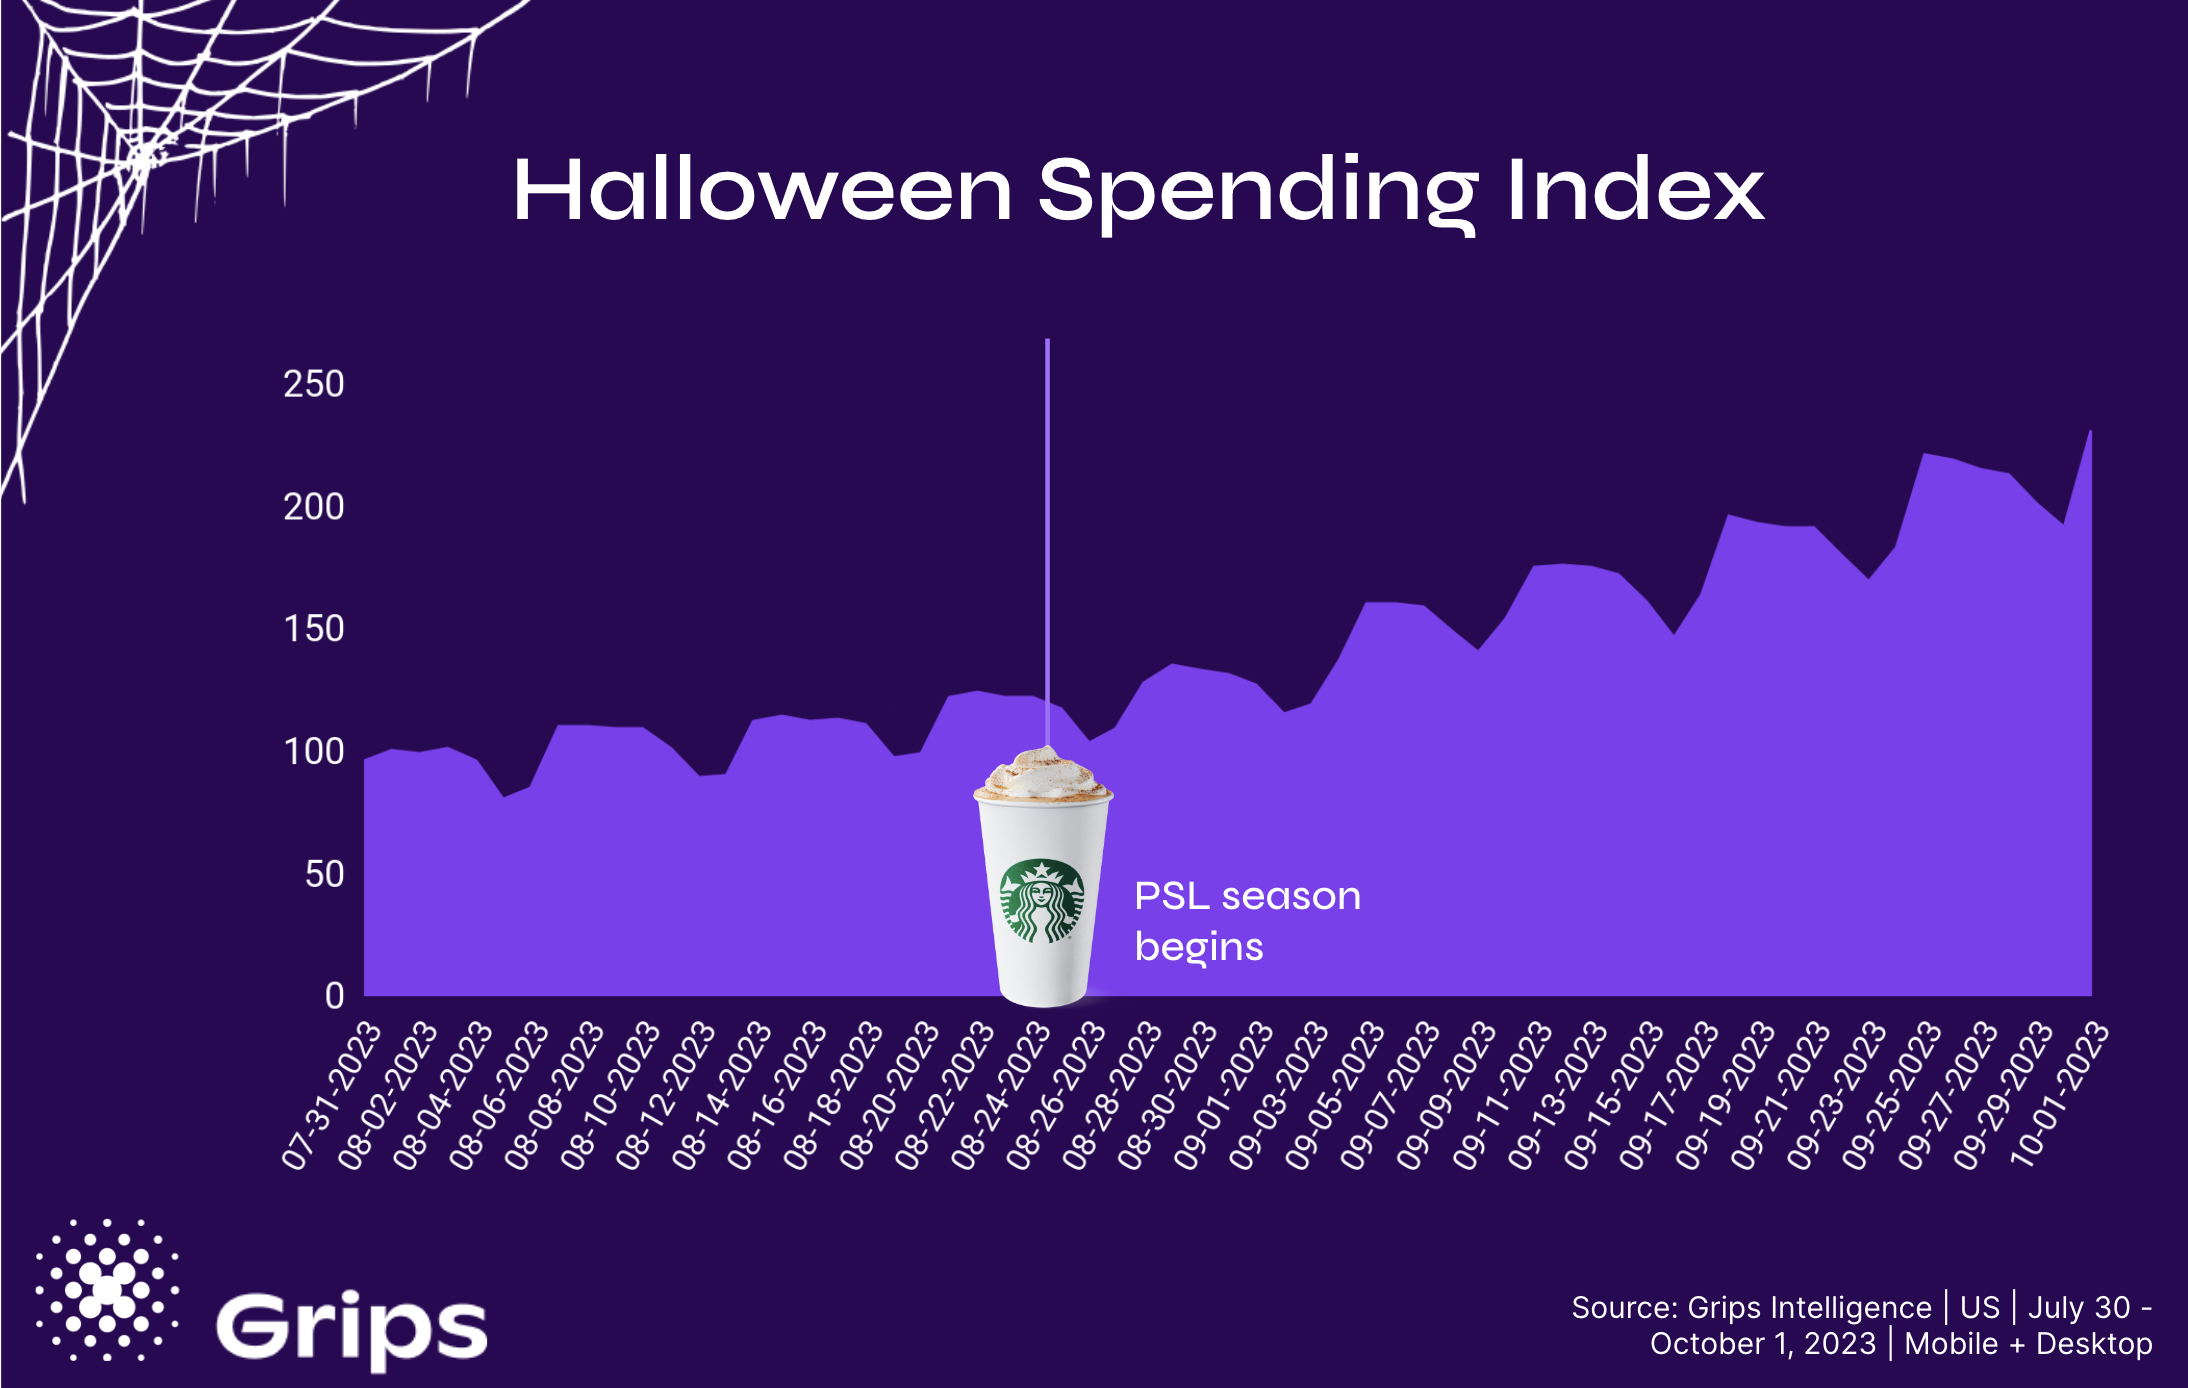
The Grips Halloween Spending Index took it up a notch with spending levels increasing by 14 percent week-over-week. That’s the second biggest jump observed this season after a 19 percent increase observed the week of Labor Day. Switching the calendar to October seems to be the driver as spending levels on Sunday October 1st saw a 26 percent boost in spending versus the previous Sunday, September 24th.
Overall, Grips found that Halloween spending has now increased by 93 percent since Labor Day weekend and by 112 percent since the Starbucks Pumpkin Spice Latte returned.
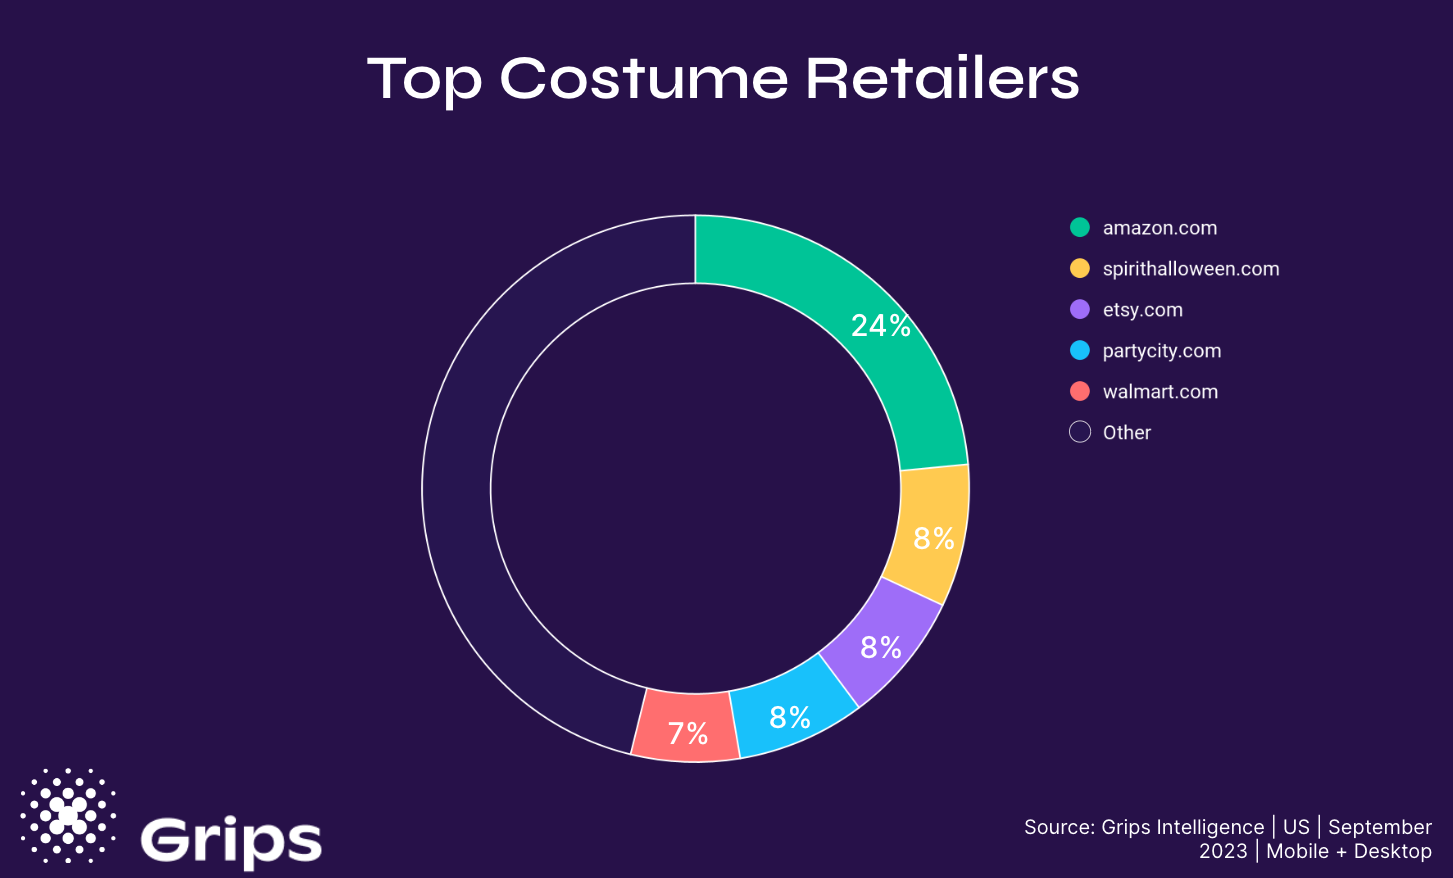
According to data just published by Grips, American spent an estimate $81 million on Costumes online in September, an increase of 4.1% year-over-year. Of that, Amazon claimed the biggest share bringing in 24% of Costume revenue. Spirt Halloween, Etsy and Party City each accounted for roughly 8% of costume revenue last month while Walmart brought in 7%. Compared to 2022, Spirt Halloween and Party City saw their Costume market share decline. Party City saw market share erode by a relative 34% and Spirit Halloween’s share dropped by 17%. Their struggles meant opportunity for Amazon, Etsy and Walmart, all of which saw their Costume market share increase by between 15 and 18% versus September 2022.
The average costume price in September was $26, according to Grips, relatively unchanged from last Halloween. However, Etsy’s and Spirt Halloween’s costumes cost notably more coming in at $35 and $34, respectively, on average. Halloween and costume specialty retailers consistently posted higher prices with some like EZCosplay and Romwe posting an average costume price above $100. Meanwhile, consumers spent just $16, on average, for a costume from Amazon, the lowest price of the top 10 retailers. Among the top 50 Costume retailers, Shein was the biggest bargain with the average costume selling for just $7.60.
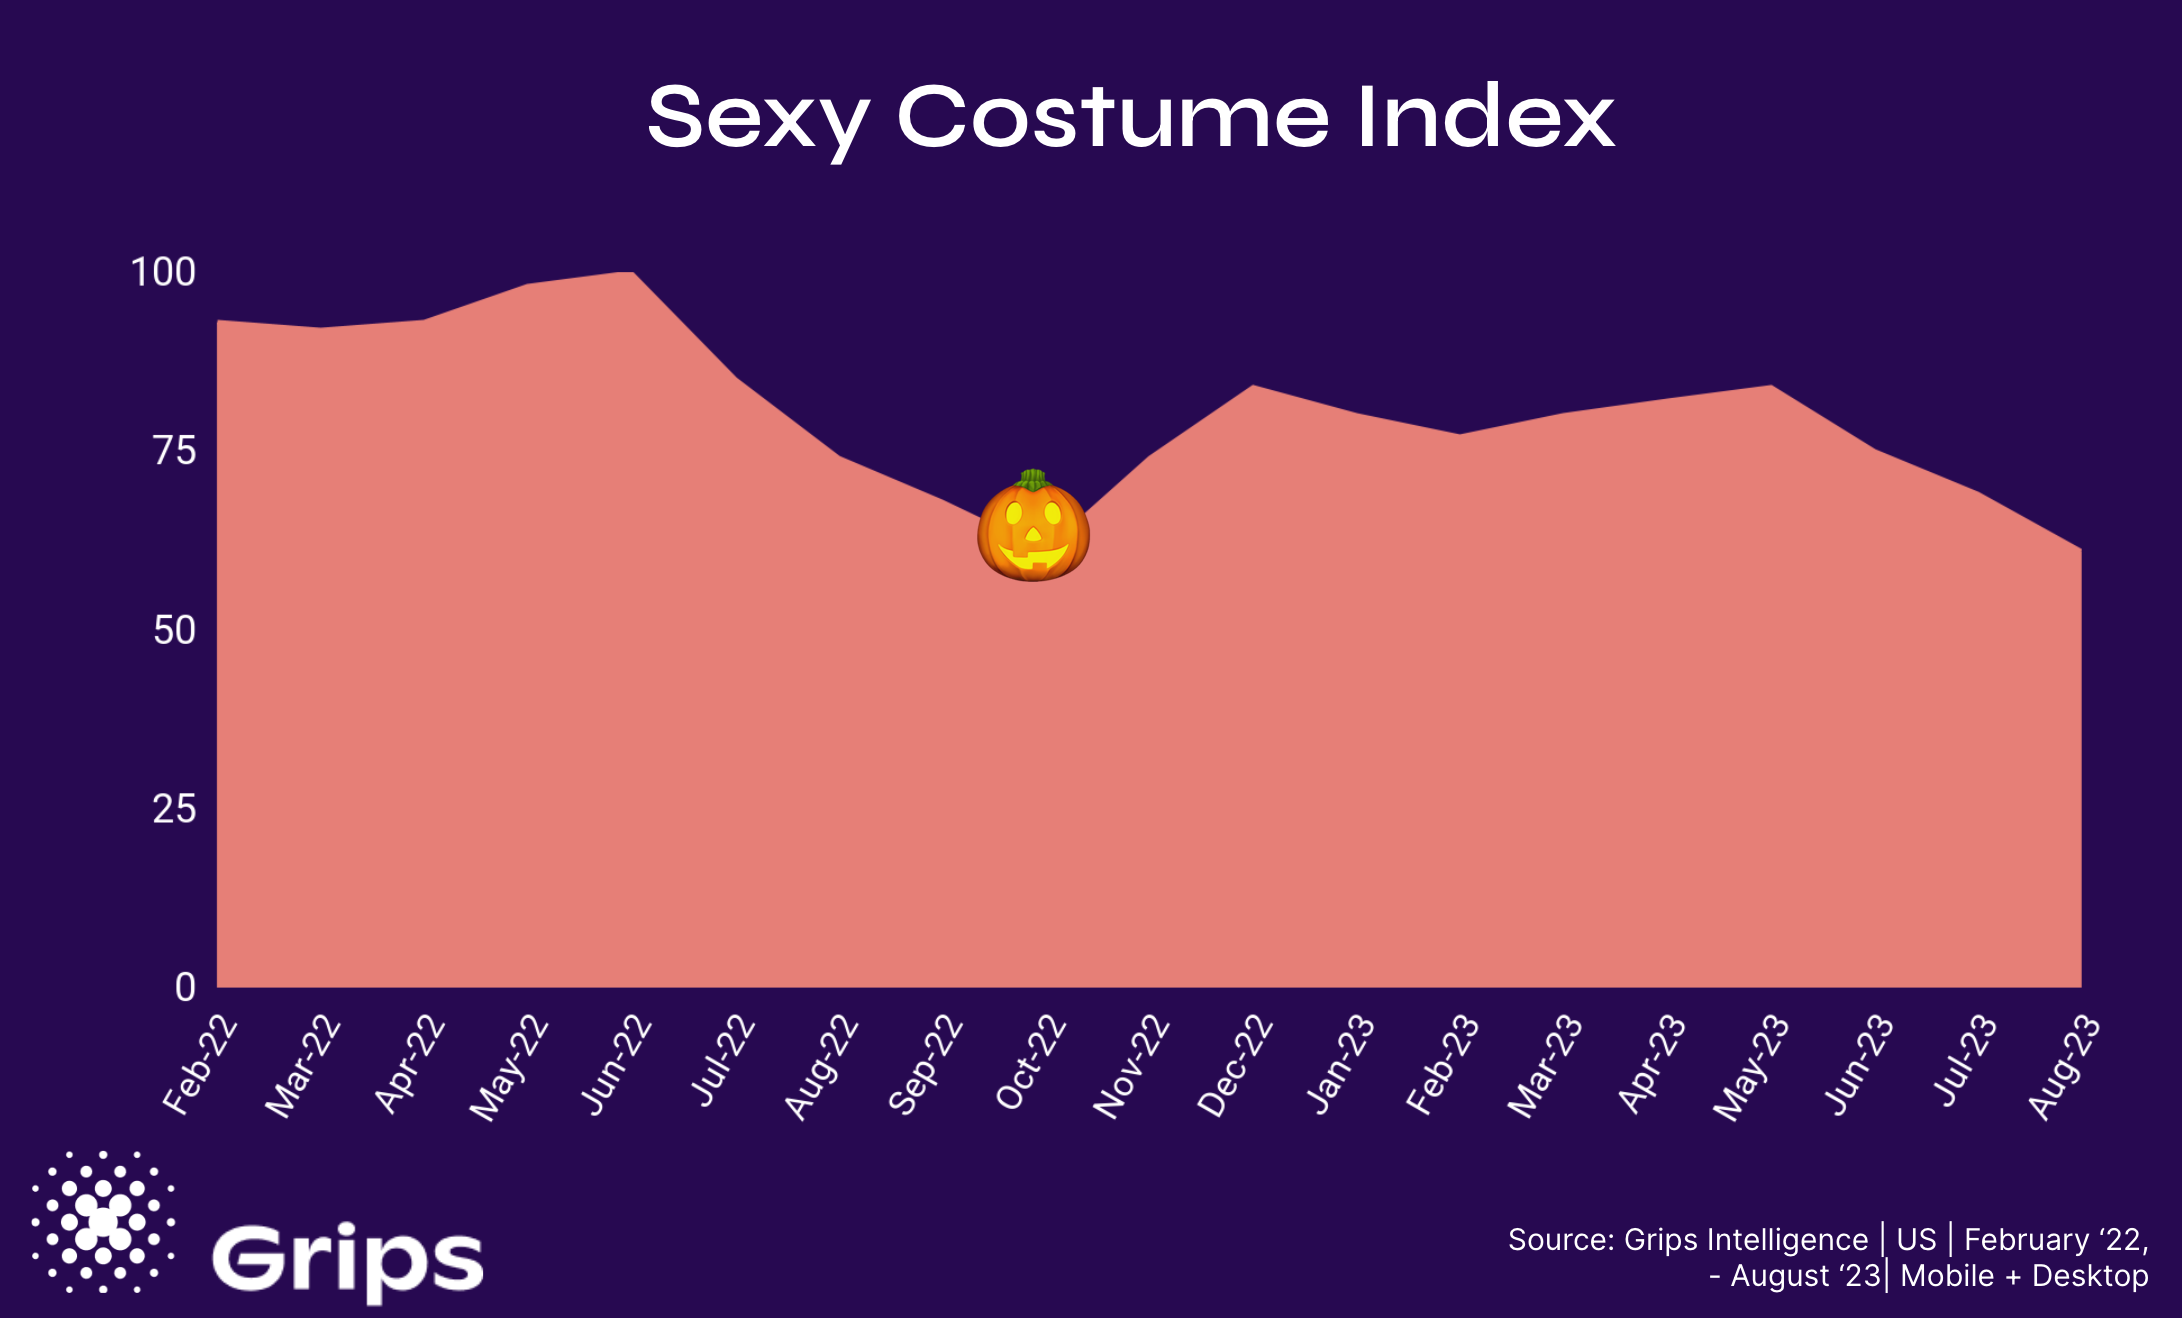
Are you promoting the right items to appeal to this year’s Halloween shoppers? Grips data suggests that Halloween revellers will be more chaste this year which may require some tactical adjustments. Specifically, we’ve observed a decline in revenue for costumes purporting to be “sexy” and an increase in candy revenues of the sugar-free variety.
In August 2023, sales of sexy costumes (meaning costumes with the word “sexy” in the product name) were down 17 percent compared with August 2022. Interestingly, looking at year-round sales, Halloween is actually the least sexy season with costume buyers the rest of the year more than 50% more focused on a sexy costume than they are in October when the Grips Sexy Costume Index drops to the lowest point of the year.
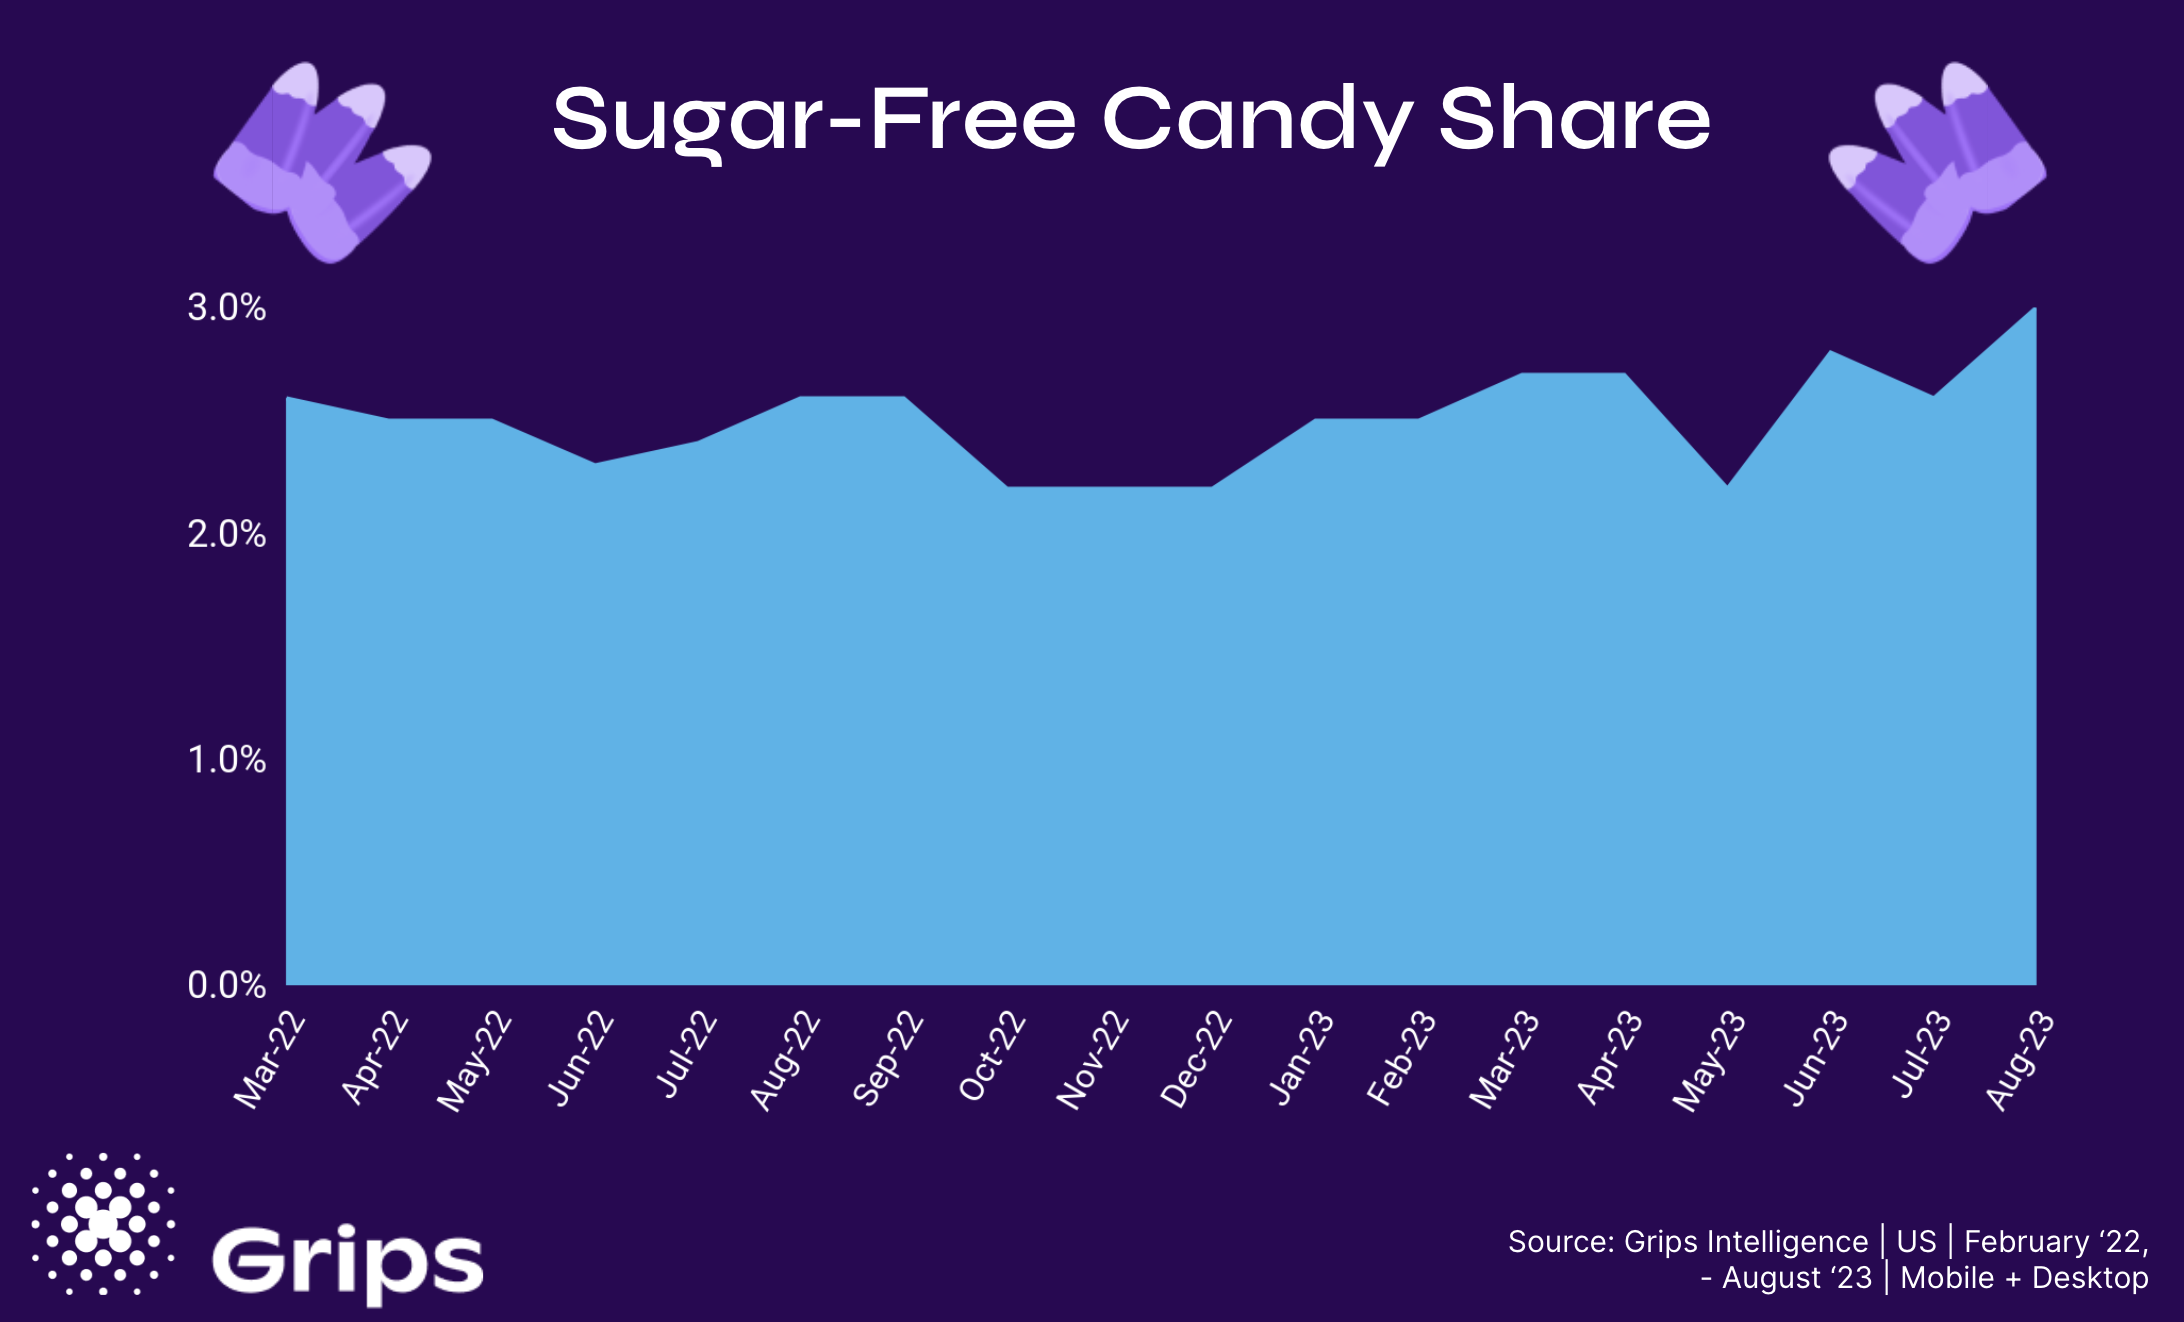
In terms of sweets, Grips is reporting that sugar-free candy has reached an all-time high in terms of the share of the overall candy revenue. In August 2023, three percent of US e-commerce candy sales were for sugar-free varieties. That’s up a relative 15 percent compared to August 2022.
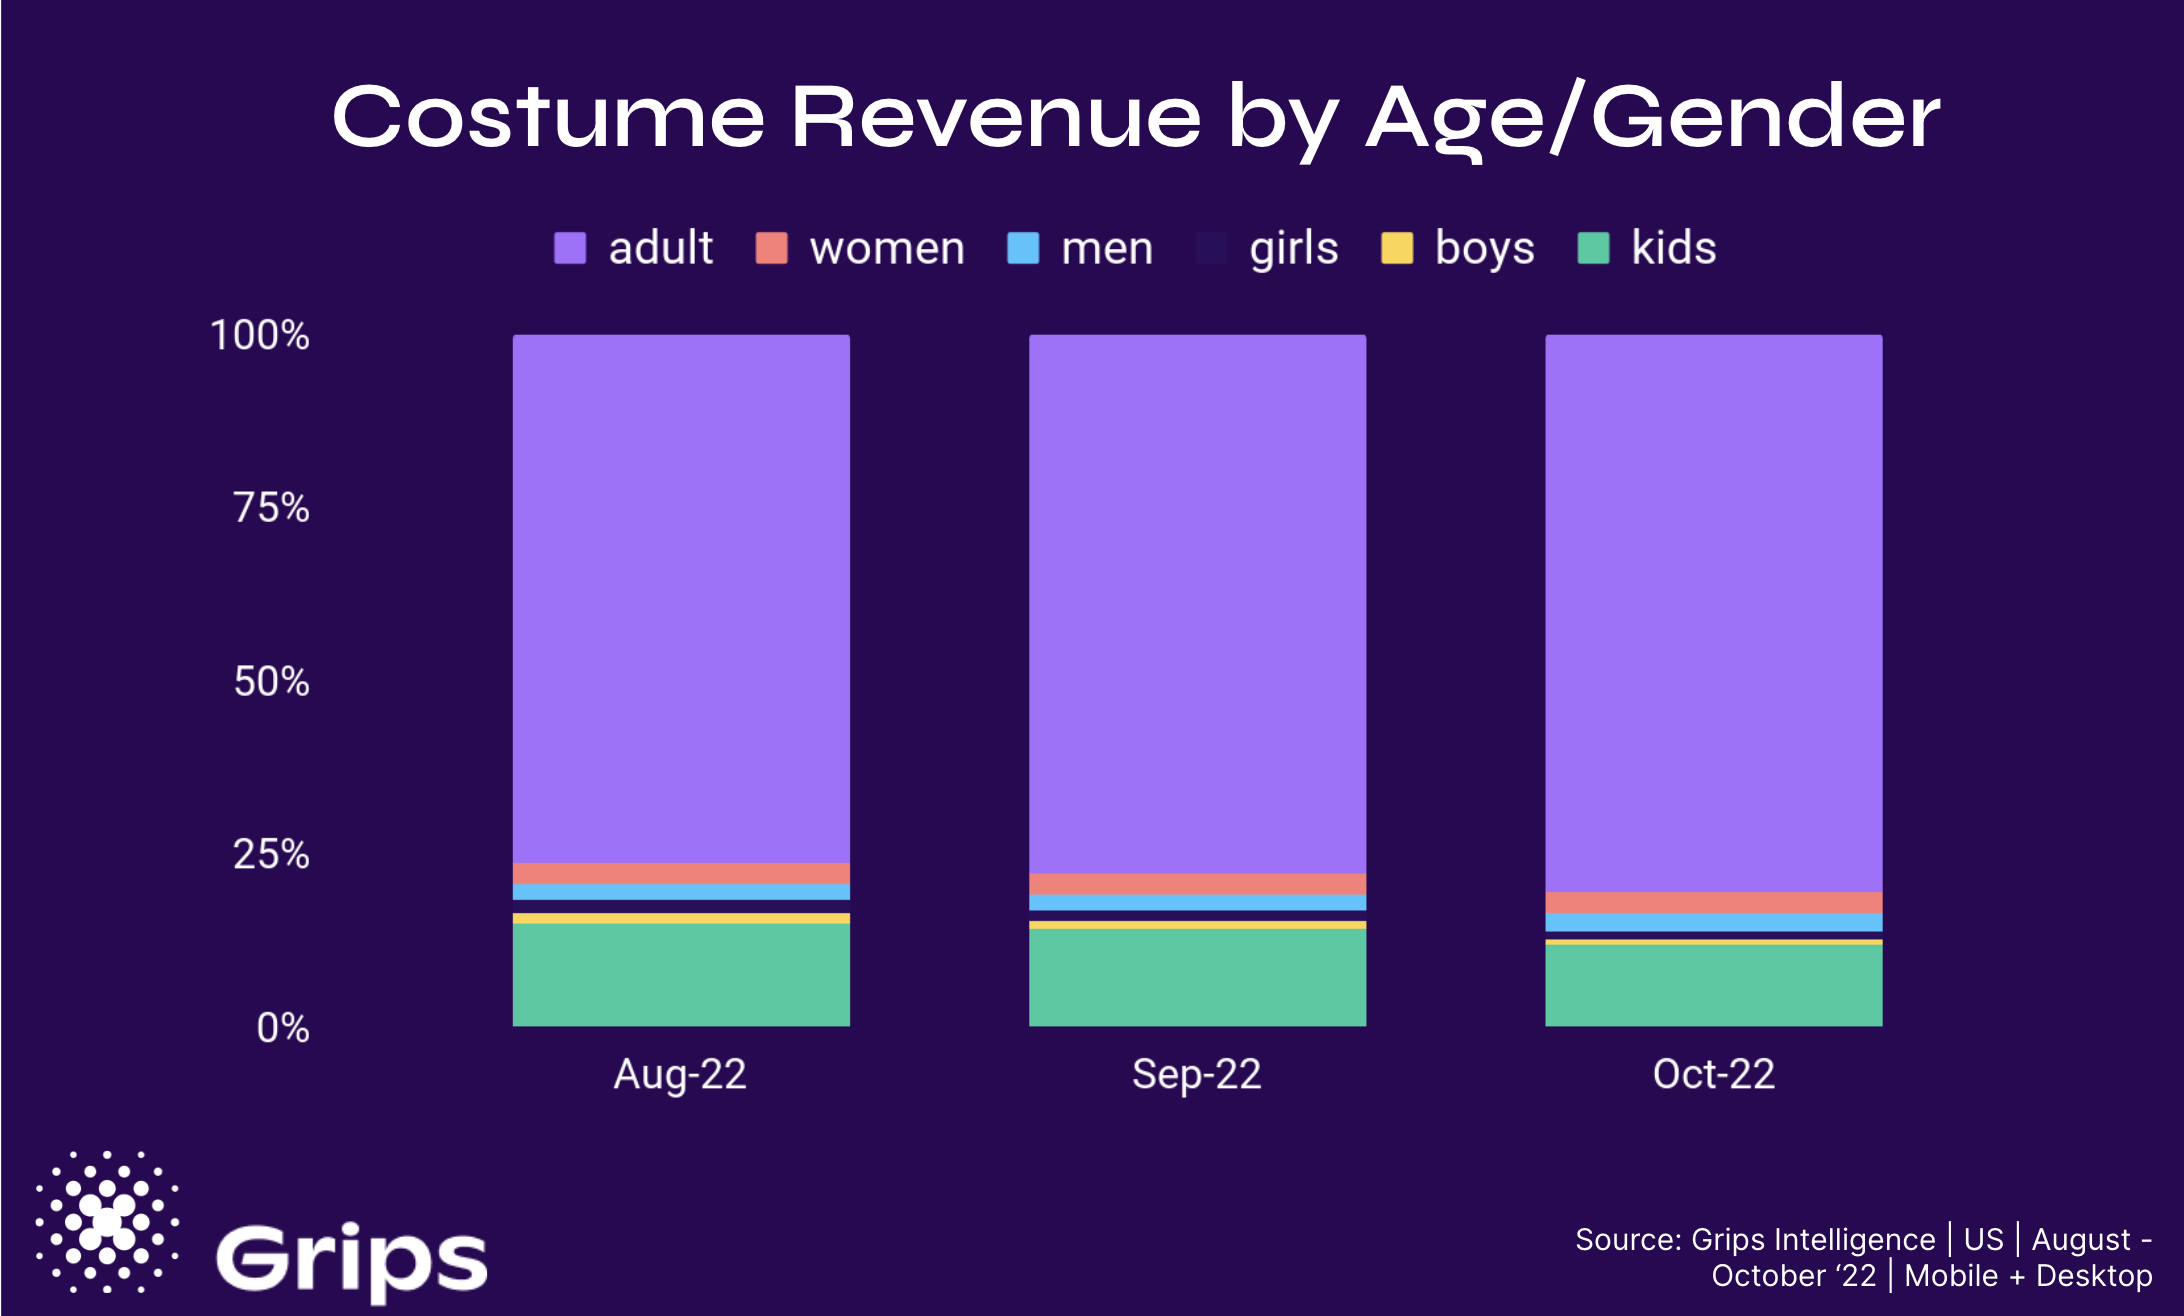
Costume sales should have seen a jump during the last week of September with Halloween only a month away. Grips data shows that while online sales of costumes is dominated by costumes for adults, kid costumes account for a greater share of category revenue in August (18 percent) being the first demographic to lock their costumes down. Last Halloween, Grips found that kids’ share of total costume revenues dropped by a relative 24 percent between August and October.
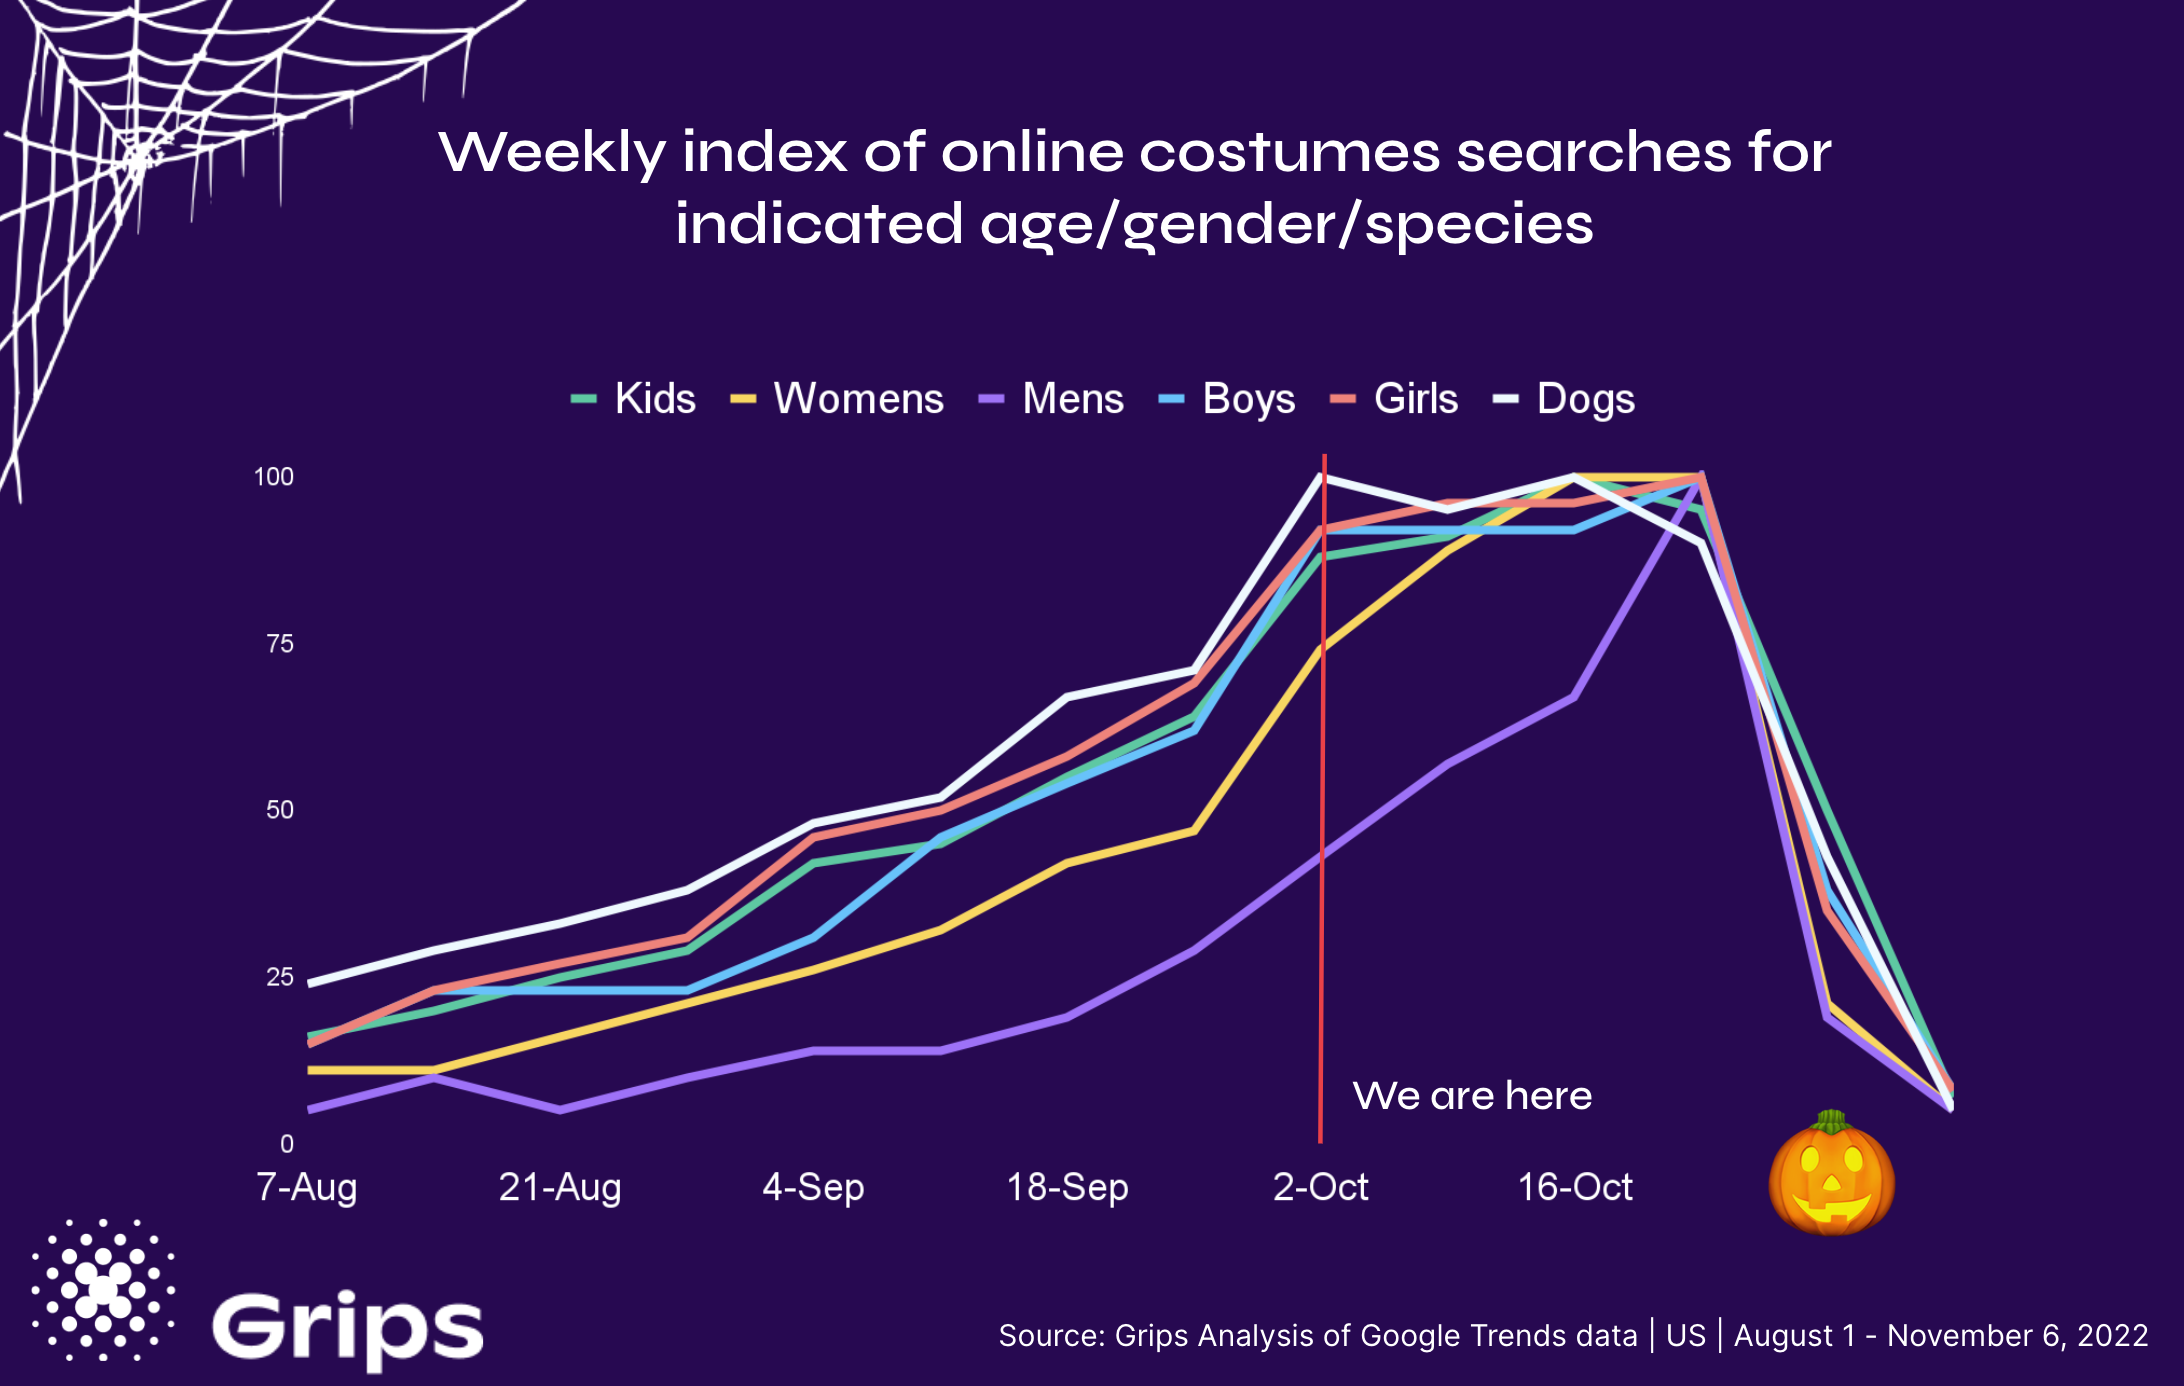
Women drive an increasing share of costume sales in September while men typically wait until the last minute, as evidenced by the Grips analysis of Google Trends data seen below. As such, retailers should be making the shift from promoting kids to women and finally towards prioritizing men’s costumes in the final days of the season.
Are you spellbound by these revelations? Well, there’s more where that came from. We’ll be updating our index every week and surfacing other seasonal Halloween trends. So bookmark this page and follow us on LinkedIn to be the first to know when there are new eerie unveilings. It’s the ultimate insider’s guide to mastering the Halloween frenzy making sure you avoid any scary surprises.
Ready to dive even deeper into the mystical world of competitive intelligence? Join us for an exclusive demo session that will be sure to capture your attention.
With Grips, you’ll peer into the spectral realm of retailer-level insights making you a true retail sorcerer. So join us, and let’s conjure up success together! Schedule your enchanting demo today.

October 19, 2023: Download a PDF of the press release