the report
Is your brand maximizing DTC sales?
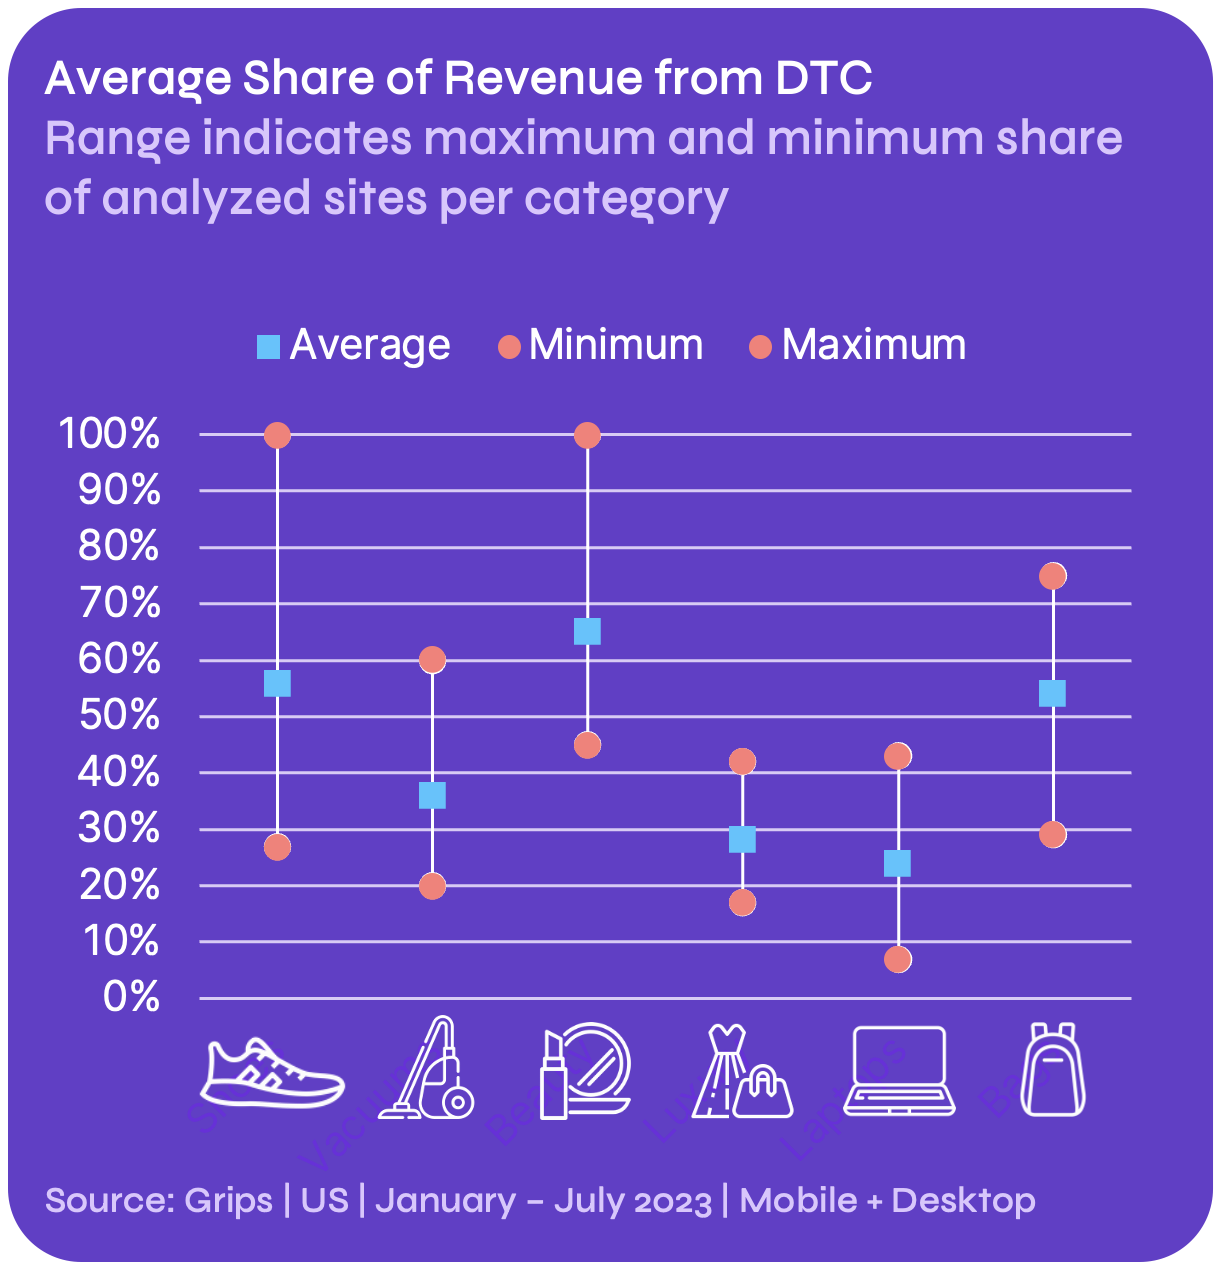
Successful competition starts with knowing not just how much your competitors make, but how they make it. In this analysis, Grips found a wide variation in the share of revenue derived from DTC both across and within different verticals. For instance, the average laptop brand analyzed in this report receives just 24 percent of revenue from DTC while DTC drives over half of the revenue for the average shoe brand. Understanding these nuances provides valuable insights that will fuel your successful growth in today's dynamic market.
This comprehensive analysis meticulously scrutinizes the share of revenue derived from the DTC operations of 40 leading brands across six prominent product categories.
The takeaways

Average Price
Grips found a discernible tendency for shoe brands with higher DTC shares to maintain relatively higher average prices on their websites

Digital Natives
Newer digital native beauty brands have been quicker to add retail partners than legacy brands

DTC Exclusive
Consumers spend 2 to 3 times more when buying luxury fashion brands DTC than they do from retailers due to their selective assortment strategy