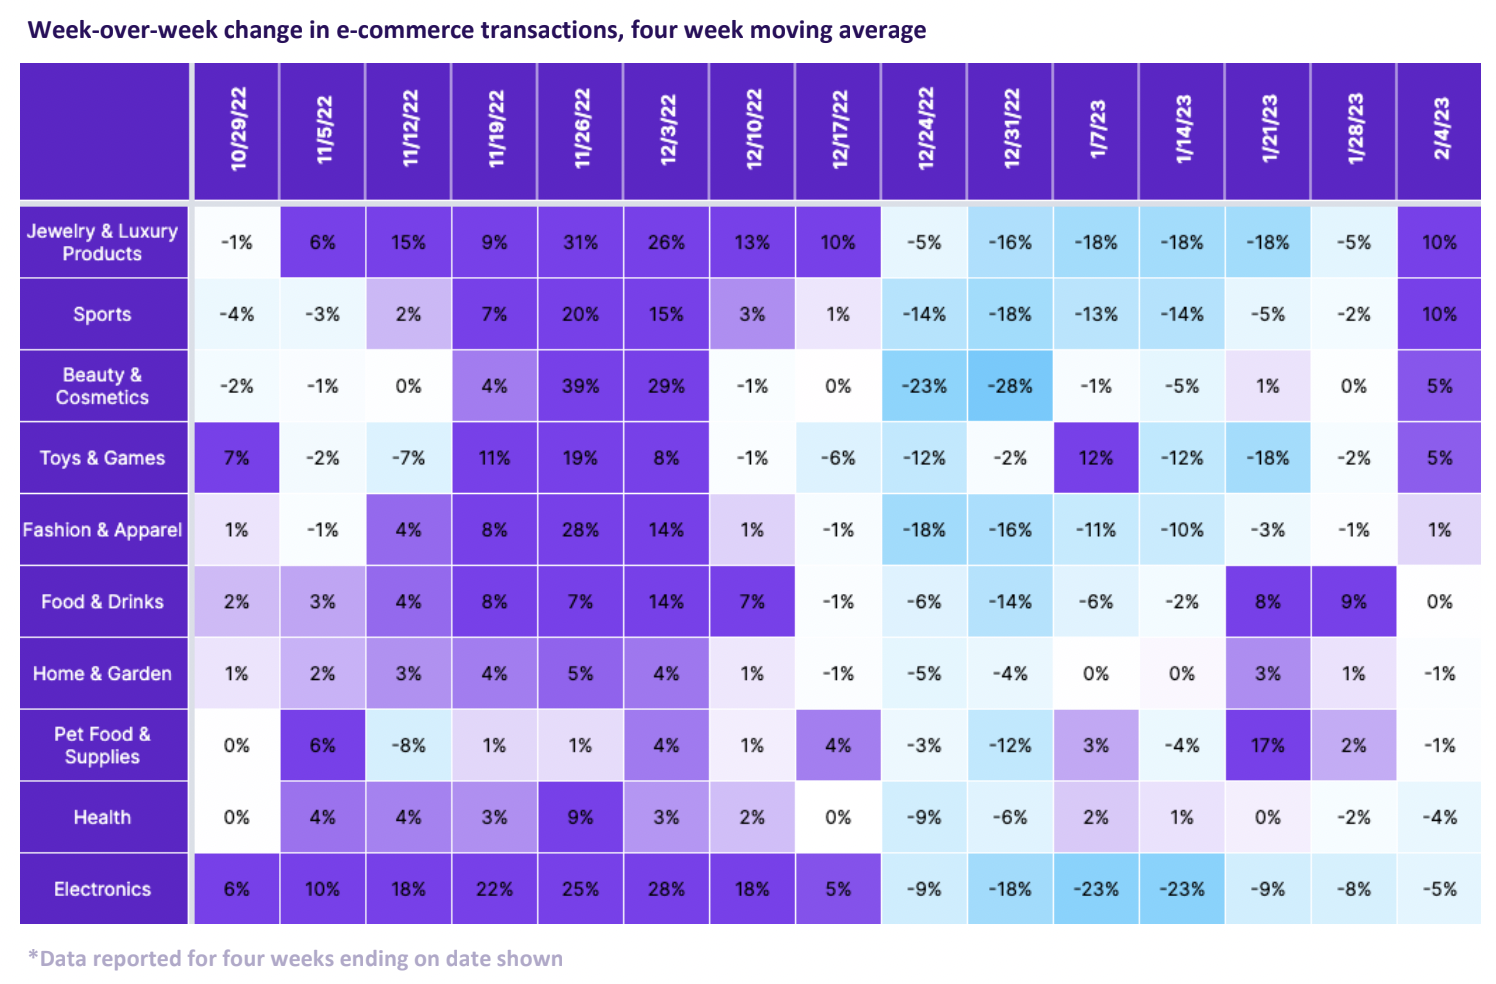
Week-over-week trends
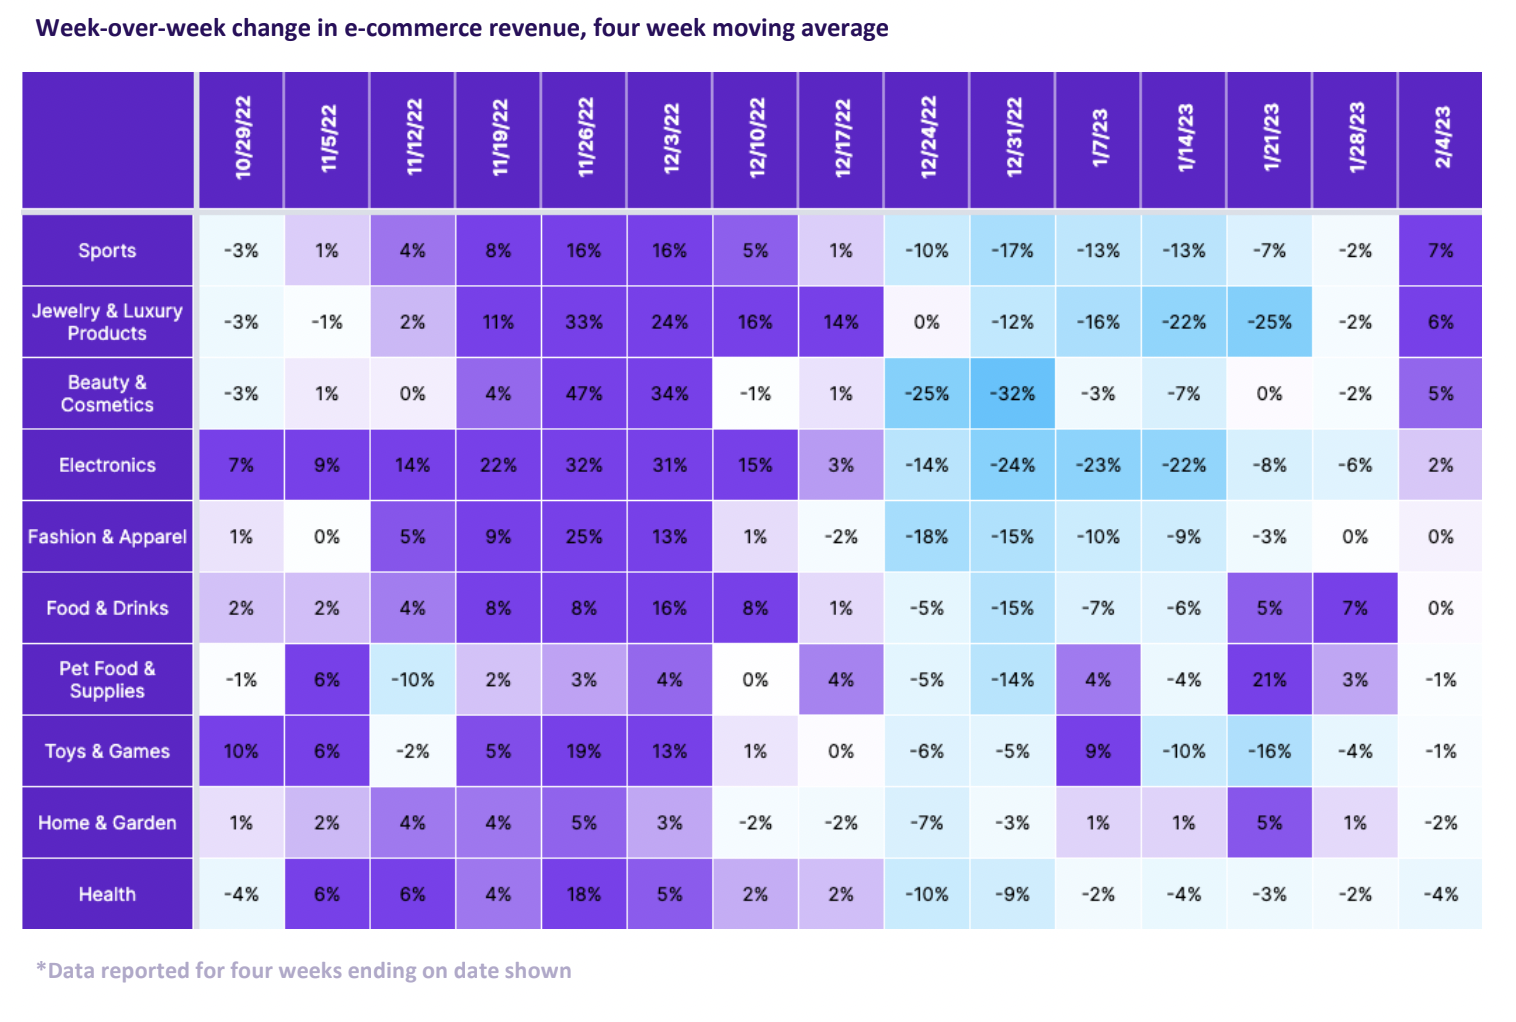
Transactions in the US decreased in January but began to pick up in February. This was expected following the holiday season which spanned from October to December last year, resulting in a significant drop in transactions in January, with most categories experiencing consistent double-digit declines. Exceptions included: Food & Drink, Home & Garden and Pet Food & Supplies, which rebounded more quickly posting weekly gains in January. However, as February began, the winds shifted, with many categories starting to see growth again, some of which were almost certainly driven by Valentine’s Day. Even Electronics, which had significant drops in transactions during January saw the decline slow. Revenue for e-commerce mirrored the slow conversion trend in January, with week-over-week declines occurring from the last two weeks of December through most of January and most categories starting to post gains or at least holding flat the first week of February.
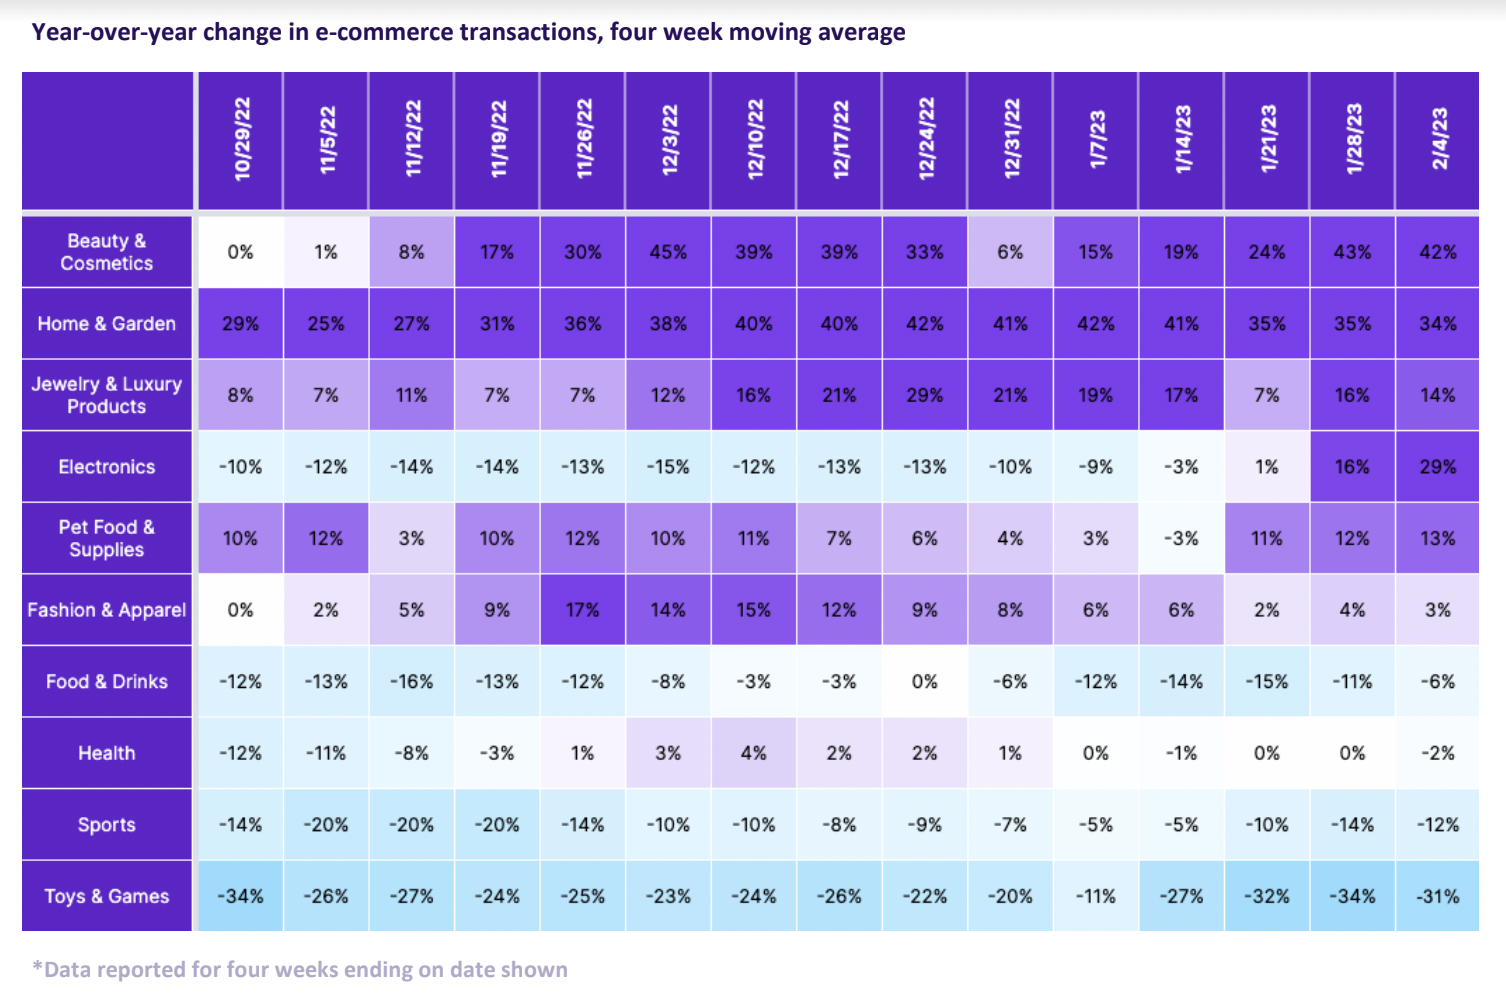
Year-over-year trends
E-commerce has improved from last year across a wide range of categories with six categories having higher transactions than in 2022, despite the observed month-over-month declines in January. Electronics was a notable category to see year-over-year growth since it had posted declines during the entirety of Q4. Food & Drink, Health, Sports and Toys & Games posted no growth in January which was consistent with their year-over-year performance before Christmas. These categories, along with Electronics, reported a similar trend of increased in-person shopping after the pandemic.
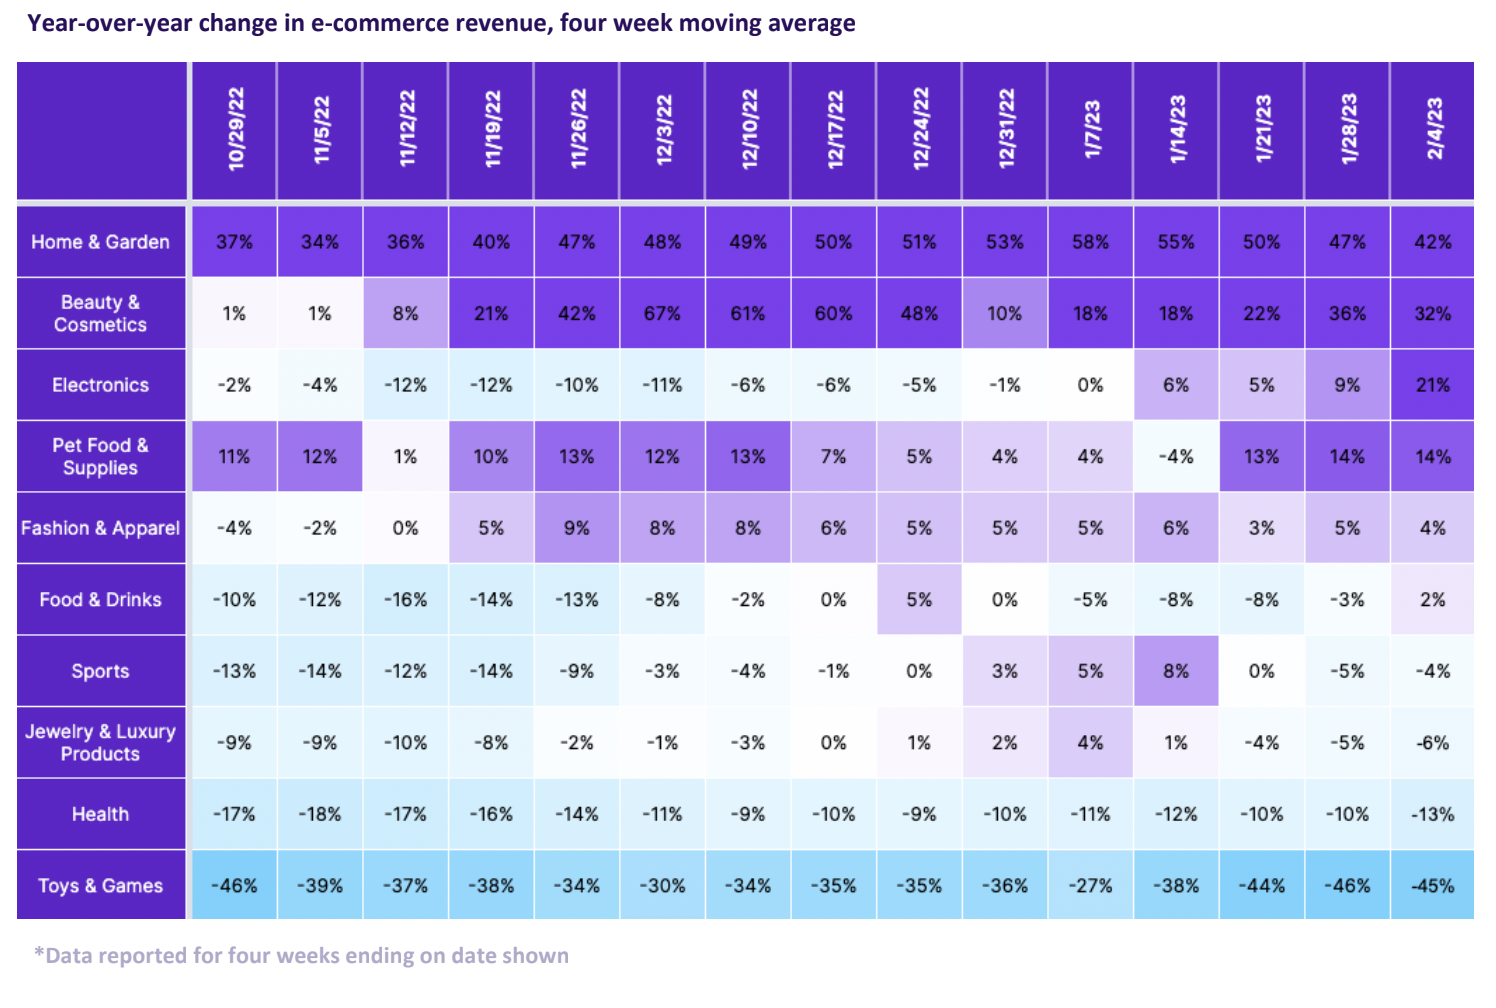
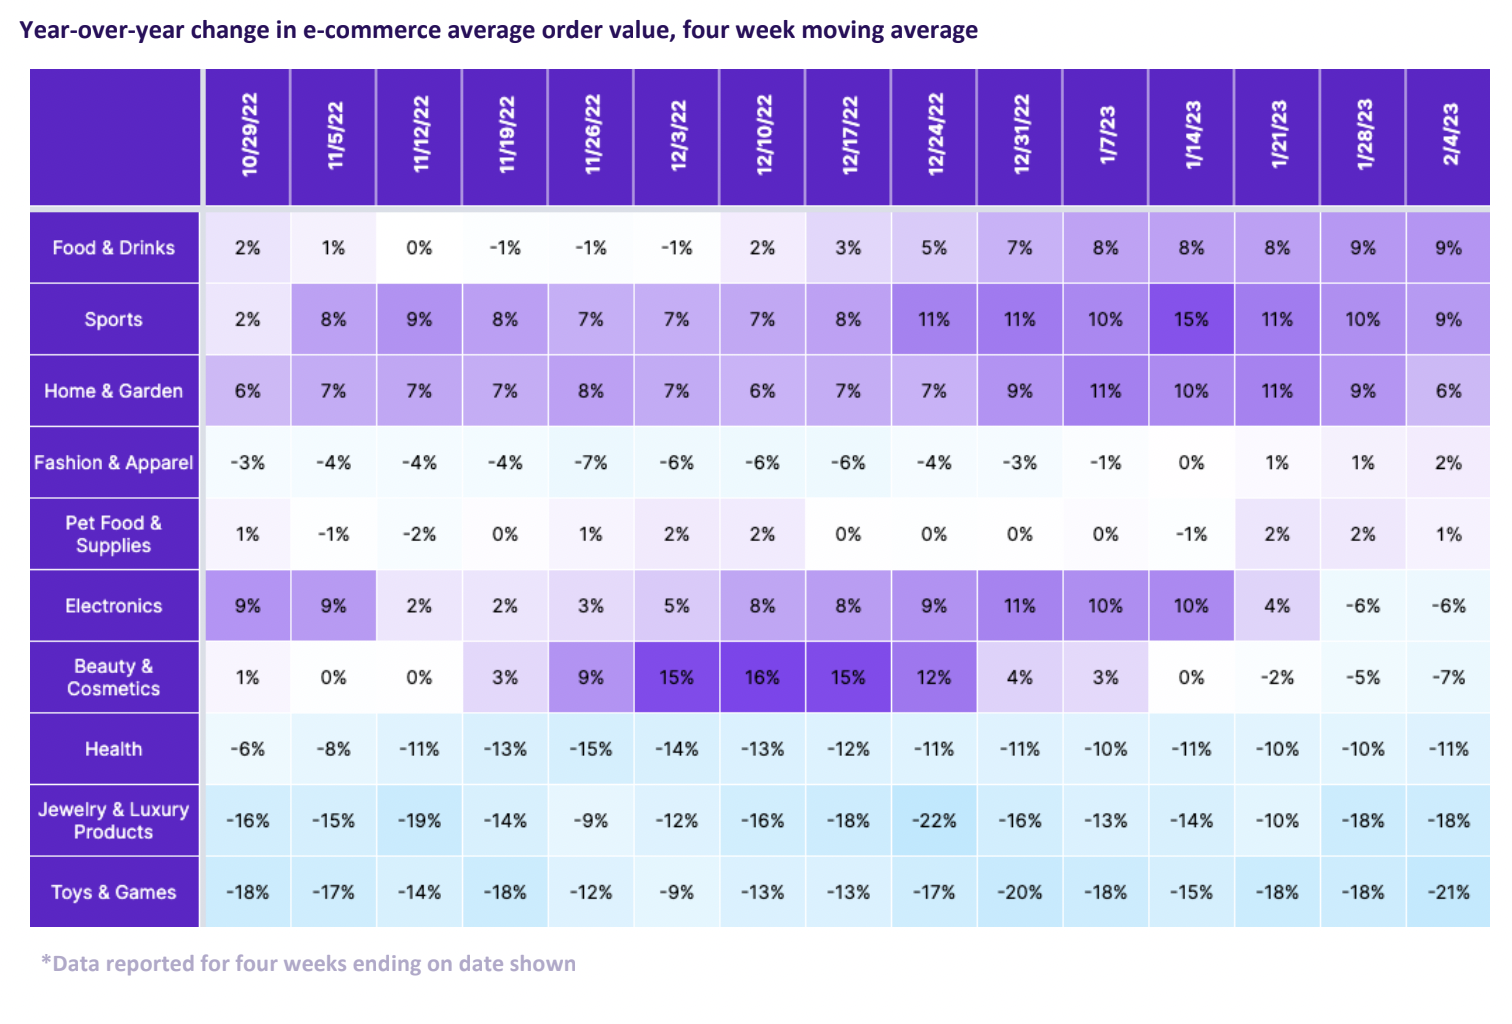
Revenues showed consistent double-digit year-on-year growth in nearly half of the categories, including Home & Garden, Beauty & Cosmetics, Electronics and Pet Food & Supplies. However, Health and Toys & Games saw double-digit declines during this period. Finally, four categories in January consistently had an average order value growth that exceeded inflation for two or more weeks. Categories that had declines in transactions and revenues had higher average order values, implying that consumers spent more per order but bought less or less frequently. The Electronics and Beauty & Cosmetics categories had average order growth in early January, but the trend turned negative as the month progressed. However, this decline in average order value coincided with Electronics posting YoY revenue gains again, which may have convinced consumers to buy.