If you missed our info-packed Holiday unwrapped webinar, here are five trends that we revealed. Want to learn more? Get access to the full recording here.
Winners and losers
It’s no secret that merchants (e-commerce and brick-and-mortar stores alike) faced challenges in 2022 which meant that there was even more riding on the holiday season than usual last year.
Unfortunately, Grips found that many key consumer categories were visited by the Grinch with seasonal revenues coming in below 2021 levels. This was more widespread in the UK and Germany where all but a couple categories posted a drop. In the United States, Grips reported that four of the 10 categories reported on in the webinar posted year-over-year declines in both e-commerce revenue and transactions, including: Toys & Games, Electronics, Sports and Food & Groceries. Winners in the US included Home & Garden, Beauty & Cosmetics, Fashion & Apparel and Pets, all of which posted increases in both revenue and transactions. (See chart below)
In the Fashion & Apparel category, which was the biggest in terms of overall e-commerce revenue, Gap.com brought in an estimated $368 million in e-commerce revenue in the US during the month of November making it the category’s top site. Relative newcomer Shein.com also made it into the top five with $257 million in revenue.
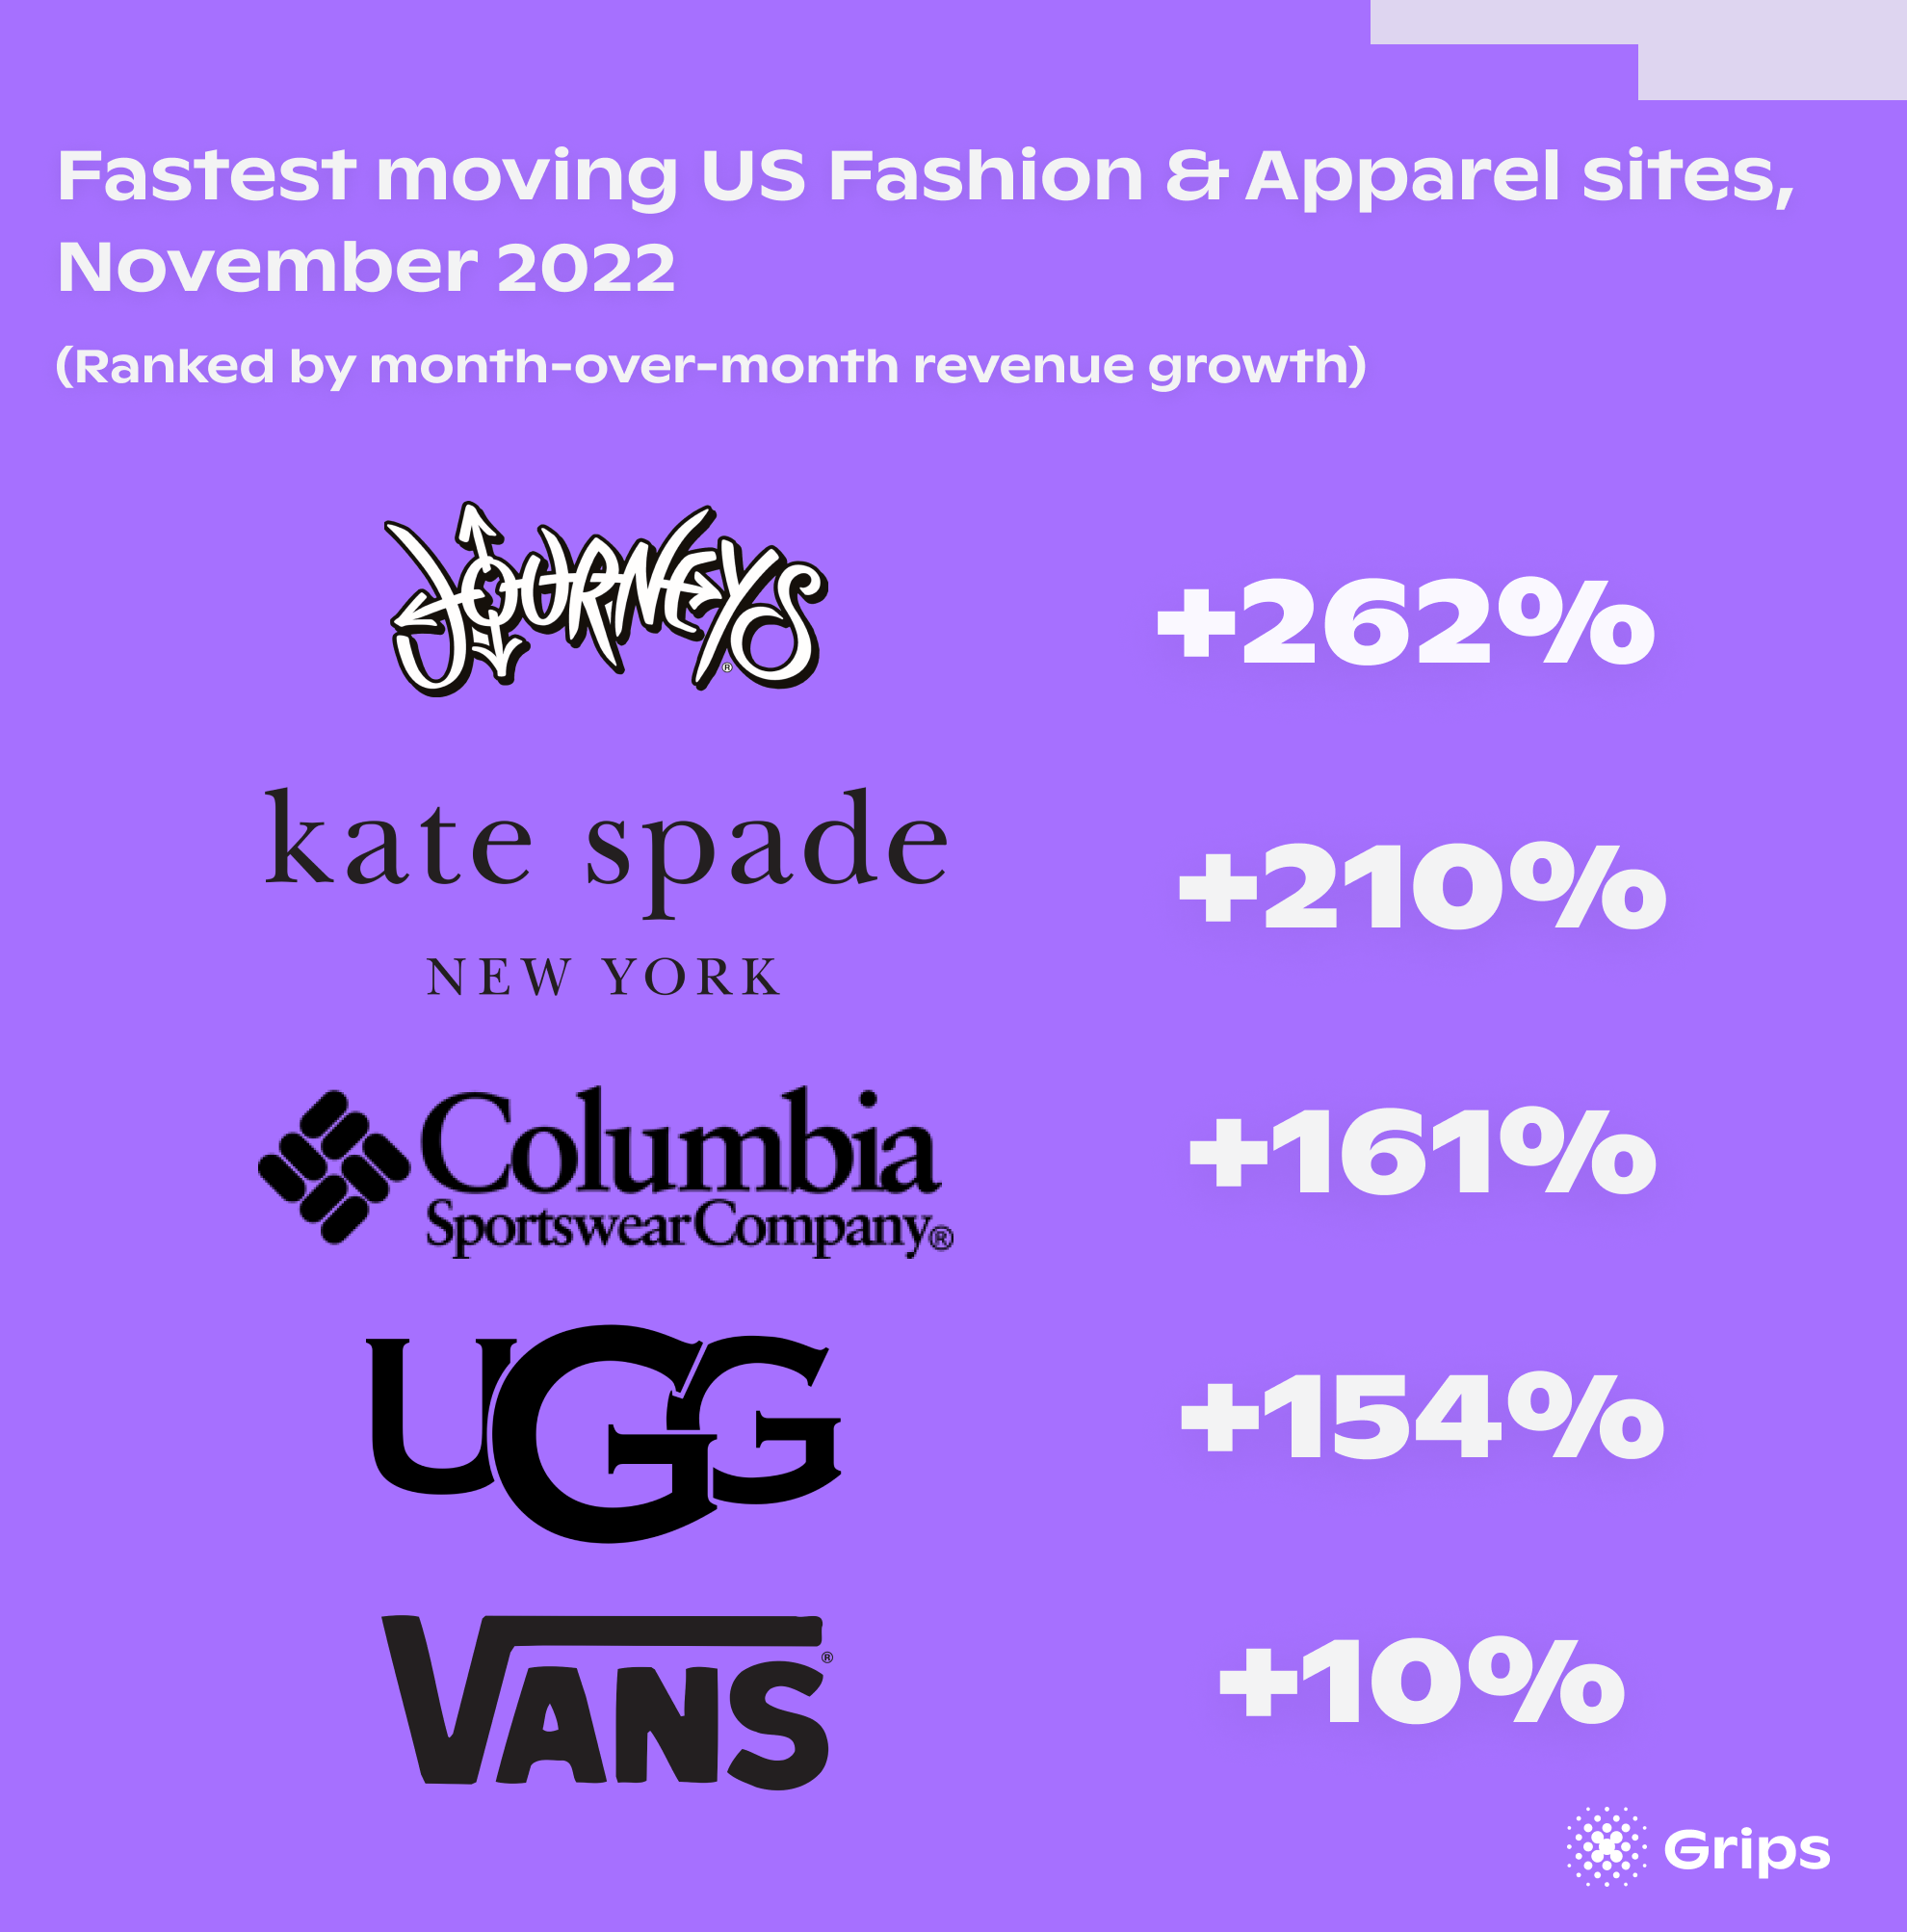
Fashion sites that didn’t rank among the top, but which saw significant revenue growth during the holidays tended to be those targeting younger consumers and footwear brands. These included Journeys.com and Ugg.com, both of which saw e-commerce revenue grow by more than 150 percent between October and November.
Optimize Marketing Channels
Retailers looking to get back in the black needed to focus on driving consumer spending during the holiday season. What better way to do that than to ensure that your marketing mix takes into account a channel’s ability to drive revenue and not just visits.
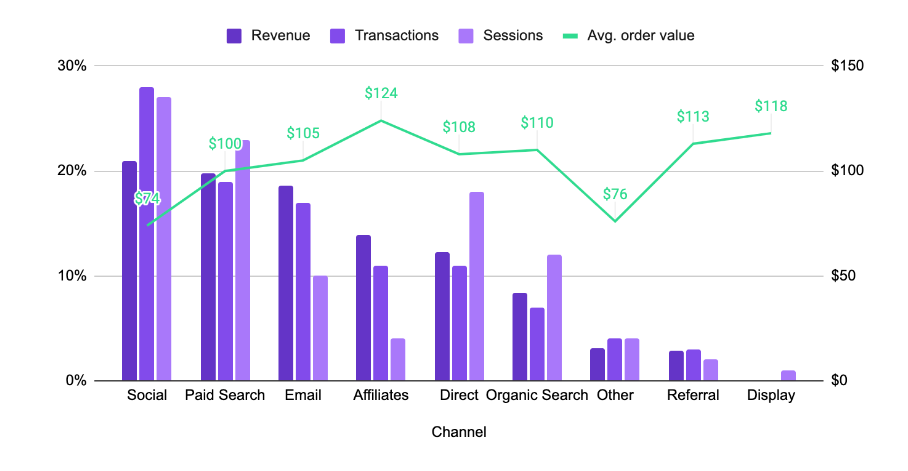
During the webinar, Grips revealed the top revenue-generating digital marketing channels for key categories, including Beauty & Cosmetics. The chart below shows that in the United States, Social was the top channel driving Beauty revenue during the peak holiday shopping months of November and December, accounting for a fifth of all revenue generated. Interestingly, Social accounted for less than five percent of Beauty & Cosmetics revenue in the UK or Germany during the same time period.
While Social generated the most revenue in the United States, it posted the lowest average order value (AOV) with the typical transaction from social totalling just $74. Affiliates, by comparison, brought in 14 percent of category revenue with a much higher AOV of $124 making it a more efficient channel for driving sales. Having data like this can help improve channel optimization during the holidays and throughout the year.
Optimize audience targeting
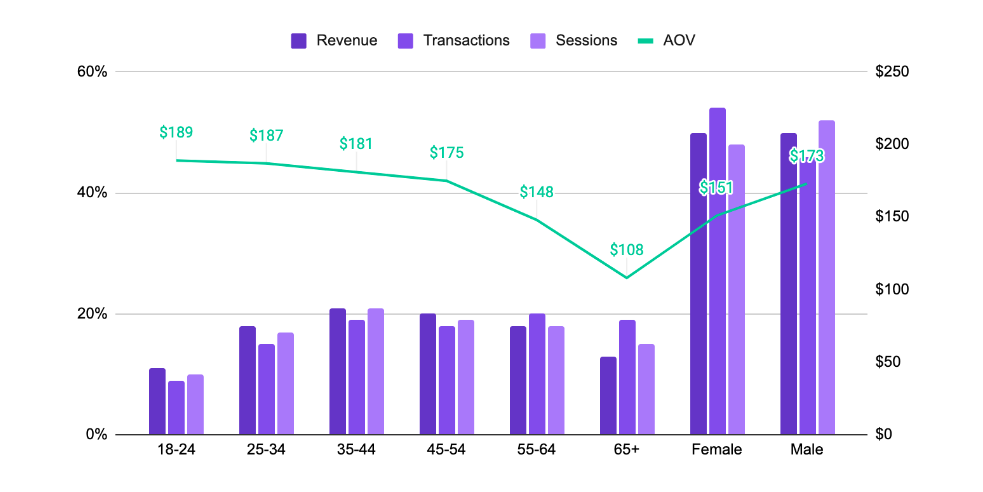
In the Home & Garden category, the top growing category in the US, spending varied sometimes significantly between demographic groups. For instance, Grips found that while men and women accounted for a similar share of revenue, women converted more often but spent, on average, $22 less than men on a typical purchase. The chart below also illustrates how AOV declines with age with the drop most notable among older Gen Xers and Boomers. Americans age 65 and older, for instance, spent just $108 per transaction compared to $189 spent by those 18 to 24.
With this information, merchants can benchmark their own performance against the category average and optimize targeting and messaging to increase spending and/or frequency of transacting from each group.
Hot products
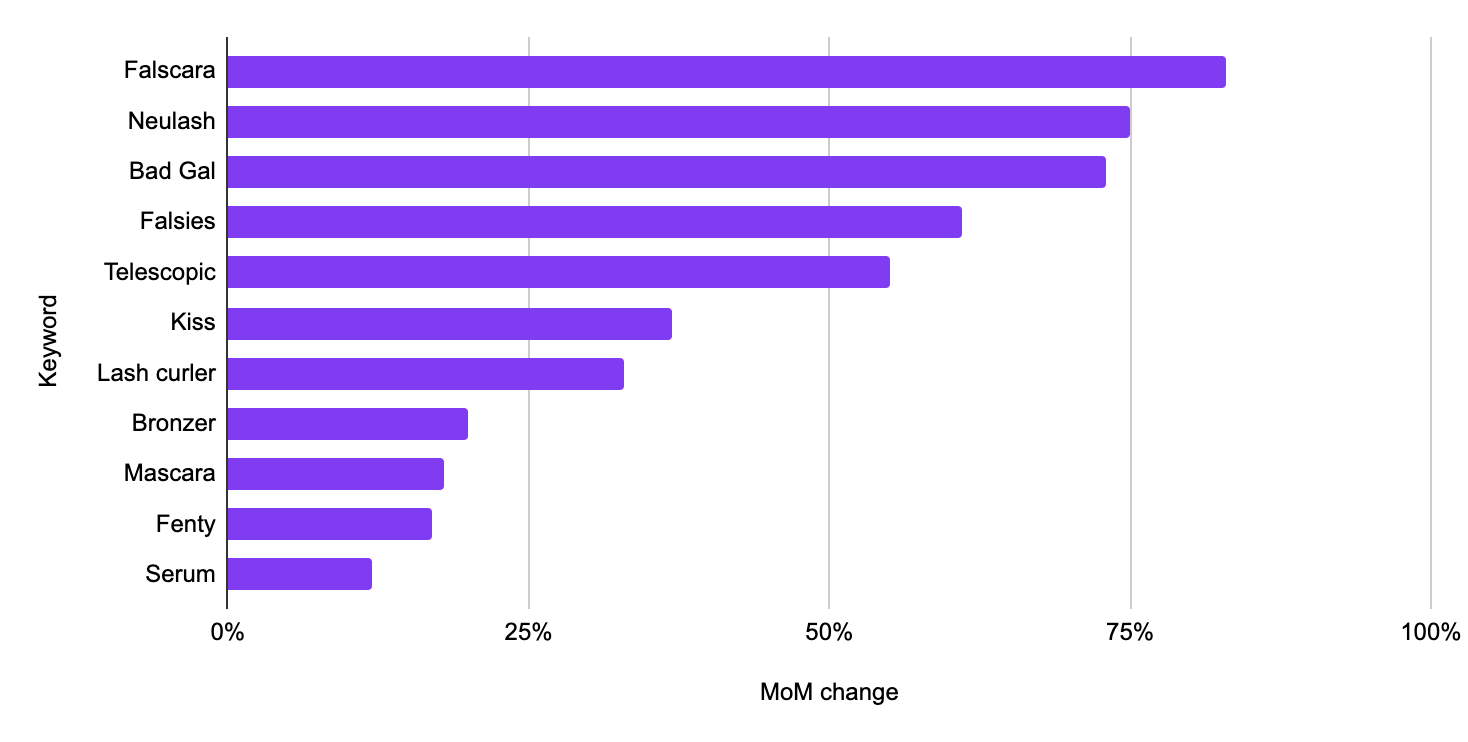
Finally, Grips looked at trending products during the holiday season during our Holiday Unwrapped webinar as well, including the types of products that saw revenue in the Beauty category increase the most during the month of November. In the chart below, we can see that searches containing the word “Falscara” saw revenue from Organic Search increase 83 percent between October and November. Other top trending terms also focused on lash products, including “Neulash” (+75 percent), “falsies” (+61 percent) and “telescopic,” as in telescopic mascara (+55 percent).
Merchants prioritizing these products from sourcing to sales to SEO will allow them to capitalize on current consumer demand by getting clicks and generating sales.
You can learn more about these and other trends that Grips found, including additional categories and trends in the UK and Germany by watching our free webcast on-demand. Registrants will also receive a download of the full presentation.