Grips reports that Pets & Animals sites in the US generated $5.3 billion in revenue in 2022 converting 4.9 percent of the 1.2 billion category visits into sales—one of the best conversion rates of any category. A majority of Pets & Animals visits now occur on mobile devices, as do a majority of transactions and revenue, making it one of the first categories to be mobile dominant across all metrics.
Our new Pets & Animals benchmarking report, which represents nearly 500 leading Pets & Animals e-commerce sites in the United States, provides you with exclusive competitive intelligence into one of the fastest growing e-commerce categories in the United States to help you understand the the Pets & Animals e-commerce market in more detail than ever before.
In this report you will discover:
- The e-commerce performance of the US Pets & Animals category overall and for top retailers
- Which subcategories of products generate the most e-commerce revenue
- Mobile versus desktop performance
- Fast moving sites
- Pets & Animals trends to watch in 2023
Download our US Pets & Animals benchmark report for free today.
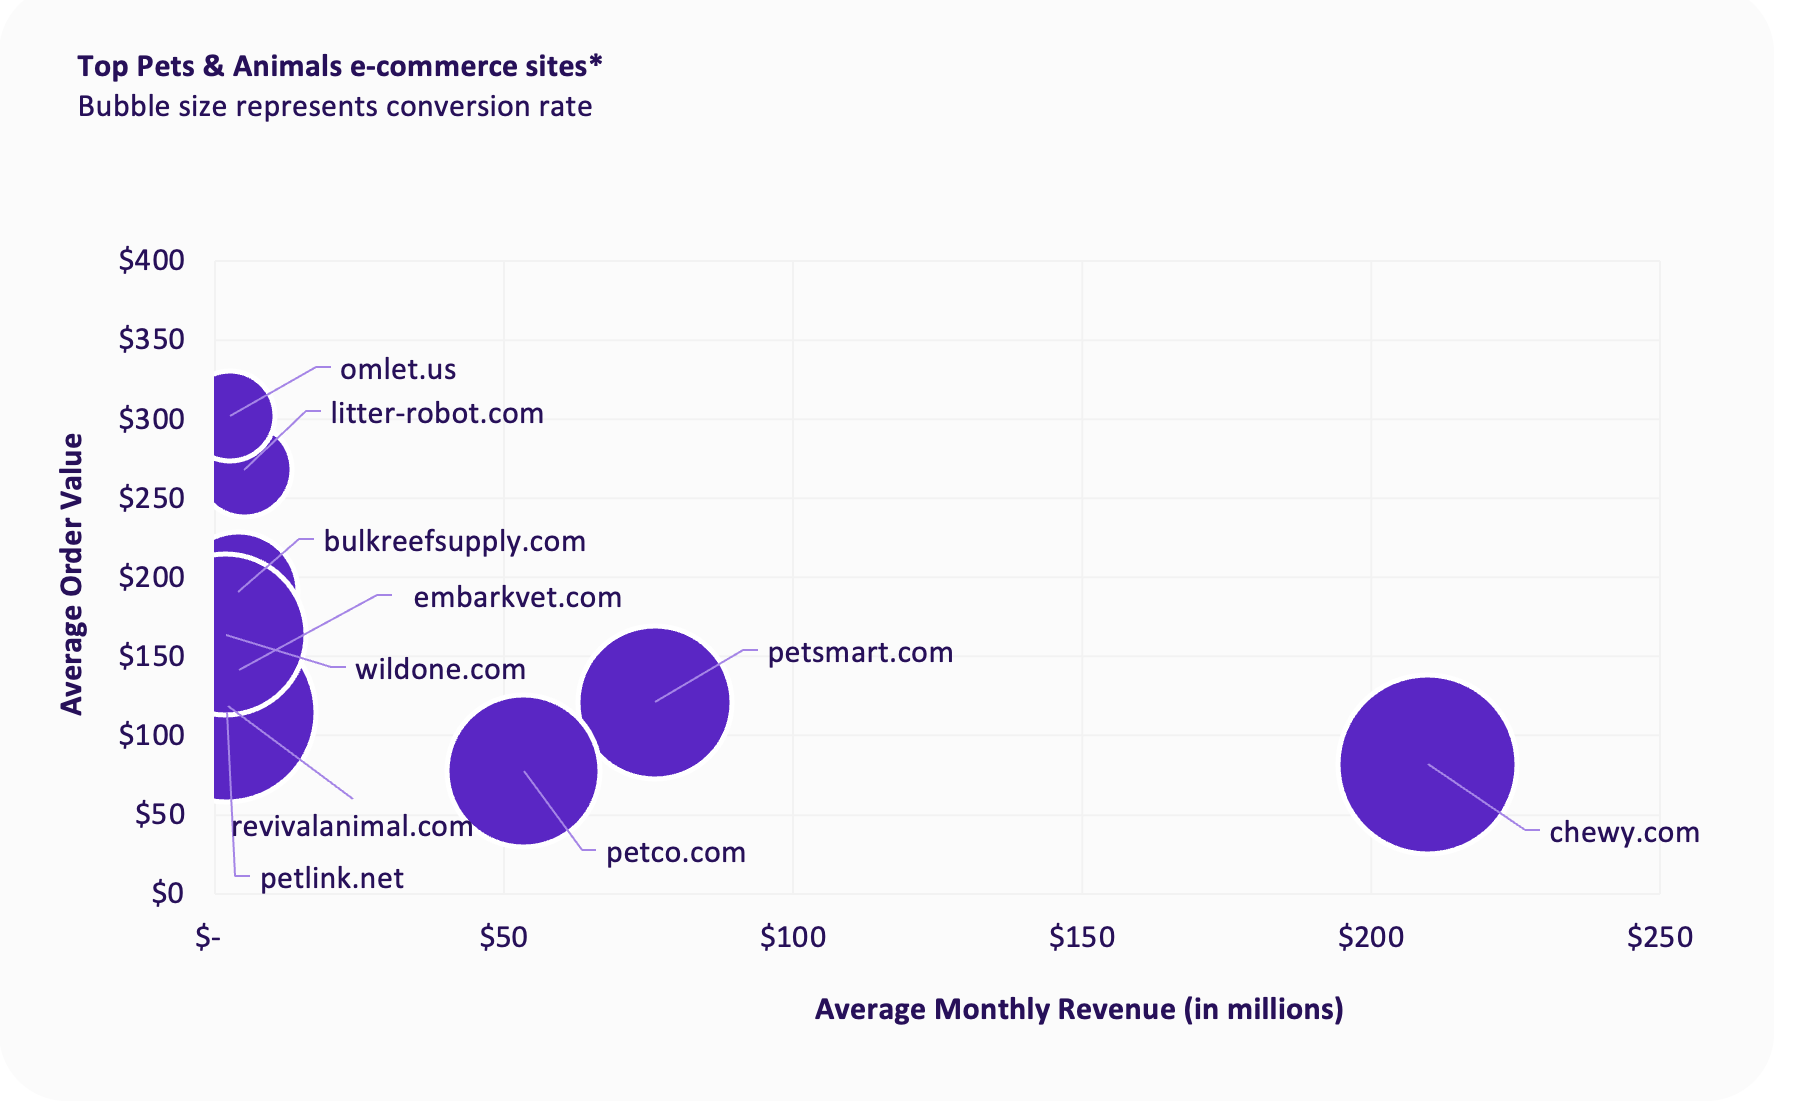
Here’s a brief preview of the type of insights that you can expect from the report: