Instant e-commerce analysis - revenue, conv. rate, AOV with Grips browser extension

Grips browser extension

Grips
Sep 2026
All countries
Home/Insights/Retailers/ccreeseboutique.com
TRANSACTION INTELLIGENCE - SEP 2026 GLOBALLY

Favicon for ccreeseboutique.comccreeseboutique.com

Start benchmarking for free
Sign in with GoogleSign up with Google
418.1
Revenue
Sep 26
178.1
Sessions
Sep 26
2.0-2.5%
Conv. rate
Sep 26
$75-100
AOV
Sep 26
Loading...

cc reese boutique is colorados #1 online boutique with affordable on-trend clothing for women! same day or next day shipping and free shipping on orders of $50! shop with us today and get 10% off your first order!

Loading...

GRIPS CUSTOMERS & RESEARCH PARTNERS

Sally Beauty logoAssembly logoWalmart logoSimpleTire logoNorthwestern University logoColumbia University logo

ccreeseboutique.com Annual Revenue and Growth

ccreeseboutique.com's annual sales on its online store amounted to $9.1K in 2025, down 50%+ from the previous year. For 2026, revenue is expected to decline by 50%+. The trend is expected to moderate.

Annual Revenue (GMV)2025
$9.1K
Annual growth forecast2025/2026
<0%
Benchmark against your competitors for free
Continue with GoogleSign up with Google
eCommerce Revenue
ccreeseboutique.com revenue by year

ccreeseboutique.com's monthly revenueOVER TIME
View real-time data

Over the past three months, ccreeseboutique.com revenue has experienced decline of N/A, compared to the preceding three months.

View real-time data
ccreeseboutique.com revenue decline for last six months
Benchmark against your competitors for free
Continue with GoogleSign up with Google
OVERVIEW
ccreeseboutique.com operates within the competitive fashion retail category, showcasing a respectable position as a niche player. For the month of September 2026, the website generated revenue for online sales amounting to $418, with a conversion rate ranging from 2.00-2.50%. The average order value (AOV) stood between $75-100, reflecting customer willingness to spend on quality items. Additionally, the site recorded a total of 178 sessions, indicating a steady level of traffic engaging with the boutique's offerings. These metrics highlight both strengths and areas for potential growth within the boutique’s e-commerce strategy.
Read more

ccreeseboutique.com competitors

ccreeseboutique.com trails reese-cooper.com significantly in all key performance metrics. In September 2026, ccreeseboutique.com reported a revenue of $418 from 4 transactions, compared to reese-cooper.com’s impressive revenue of $8,434 from 29 transactions. The session figures reveal a similar trend, with ccreeseboutique.com attracting 178 sessions while reese-cooper.com experienced 4,588 sessions, showcasing its dominance in traffic. The average order value (AOV) for ccreeseboutique.com ranges from $75-100, which is substantially lower than reese-cooper.com’s AOV of $275-300. Despite having a higher conversion rate between 2.00-2.50%, ccreeseboutique.com still trails behind reese-cooper.com, which has a conversion rate of 0.50-1.00%. Overall, while ccreeseboutique.com demonstrates some potential, it is clearly outperformed by reese-cooper.com across all analyzed metrics, indicating a considerable gap in market presence and sales performance.

reese-cooper.com screenshot
#1 reese-cooper.com
8.4K
Revenue
4.6K
Sessions
0.5-1.0%
Conv. rate
$275-300
AOV
CLOSEST COMPETITORSby revenue
TOP MARKET PERFORMERSby revenue
ccreeseboutique.com vs top market performers
ccreeseboutique.com
top retailers
conversion rate vs average order value for ccreeseboutique.com and its competitors
Benchmark against your competitors for free
Continue with GoogleSign up with Google

Industries ccreeseboutique.com operates in

ccreeseboutique.com is tracked across 1 e-commerce industry. Explore market size, leading retailers and benchmarks for each.
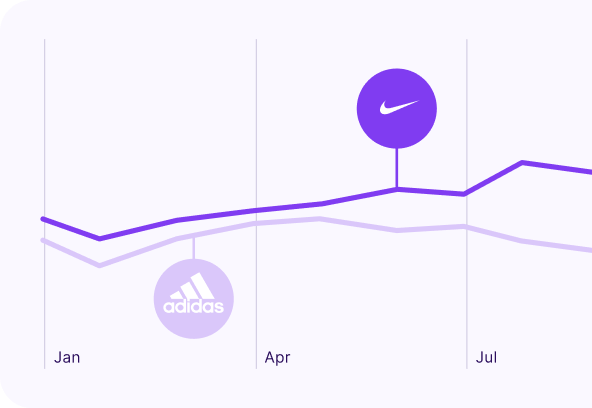
Review the entire assortment of this retailer and thousands of others in the Grips app
Sign in with GoogleSign up with Google
brands overtime comparison

Gain even more insights with the Grips app

ccreeseboutique.com channels

Identify top traffic channels that drive growth for ccreeseboutique.comand discover how performance of traffic channels has changed over time.

Sign in with GoogleSign up with Google

ccreeseboutique.com Google Ads spend

Evaluate ccreeseboutique.com's Google search ad spend, ad clicks and cost-per-click. Review performance over time and gain deeper view into their ad campaign spend.

Sign in with GoogleSign up with Google

ccreeseboutique.com devices

Review ccreeseboutique.com's performance across desktop and mobile devices. Analyze how revenue, conversion rate, transactions, AOV and sessions vary depending on the device shoppers use.

Sign in with GoogleSign up with Google

ccreeseboutique.com top markets

Explore ccreeseboutique.com's key markets, identifying countries that contribute the highest revenue, transactions, and sessions, along with those with the highest Google search ad spend.

Sign in with GoogleSign up with Google

ccreeseboutique.com country & global rank

Assess the ranking of ccreeseboutique.com among other retailers within its primary country and worldwide.

Sign in with GoogleSign up with Google
Understand how your competitors drive sales.
Drive growth and optimize key metrics with our e-commerce intelligence platform
Grips Platform Dashboard