Instant e-commerce analysis - revenue, conv. rate, AOV with Grips browser extension

Grips browser extension

Grips
Sep 2026
All countries
Home/Insights/Retailers/bouncedolls.com
TRANSACTION INTELLIGENCE - SEP 2026 GLOBALLY

Favicon for bouncedolls.combouncedolls.com

Start benchmarking for free
Sign in with GoogleSign up with Google
3.4K
Revenue
Sep 26
235.4
Sessions
Sep 26
2.5-3.0%
Conv. rate
Sep 26
$500-600
AOV
Sep 26
Loading...

healthy hair care and styling for young professionals and rising stars in the philadelphia and surrounding area. shop hair products to maintain your hair at home, custom glueless lace wigs, and extensions. behaved edge control only by bouncedolls.

Loading...

GRIPS CUSTOMERS & RESEARCH PARTNERS

Sally Beauty logoAssembly logoWalmart logoSimpleTire logoNorthwestern University logoColumbia University logo

bouncedolls.com Annual Revenue and Growth

bouncedolls.com's annual sales on its online store amounted to $374.8K in 2025, up 50%+ from the previous year. For 2026, revenue is expected to decline by 50%+. This would mark a reversal from last year's growth.

Annual Revenue (GMV)2025
$374.8K
Annual growth forecast2025/2026
<0%
Benchmark against your competitors for free
Continue with GoogleSign up with Google
eCommerce Revenue
bouncedolls.com revenue by year

bouncedolls.com's monthly revenueOVER TIME
View real-time data

Over the past three months, bouncedolls.com revenue has experienced decline of 63%, compared to the preceding three months.

View real-time data
bouncedolls.com revenue decline for last six months
Benchmark against your competitors for free
Continue with GoogleSign up with Google
OVERVIEW
bouncedolls.com outperforms a typical store in its category by showcasing impressive metrics for September 2026. The site achieved revenue for online sales of $3,419, indicating strong customer interest. Its conversion rate stands between 2.50-3.00%, reflecting an effective sales strategy that captures visitor attention. Additionally, the average order value (AOV) ranges from $500-525, suggesting customers are making substantial purchases. With 235 sessions recorded, the site's traffic indicates a steady stream of potential buyers, further enhancing its competitive edge in the market. Overall, bouncedolls.com demonstrates a solid performance, outpacing many peers in the e-commerce landscape.
Read more

bouncedolls.com competitors

In September 2026, aquage.com leads the competition with impressive figures, generating a revenue of $22,300 from 314 transactions across 6,581 sessions. Its average order value (AOV) ranges between $50-75 and boasts a conversion rate of 4.50-5.00%. In comparison, bouncedolls.com ranks second with a revenue of $3,419, achieving 7 transactions from 235 sessions. While bouncedolls.com has an AOV of $500-525, which is significantly higher than that of aquage.com, its conversion rate trails at 2.50-3.00%. Although bouncedolls.com excels in AOV, it is outperformed by aquage.com in revenue, transactions, and sessions, indicating that while customers spend more per transaction at bouncedolls.com, aquage.com attracts a substantially larger customer base. This dynamic showcases the competitive landscape where each domain has its strengths and weaknesses, yet aquage.com clearly surpasses bouncedolls.com in key metrics.

aquage.com screenshot
#1 aquage.com
22.3K
Revenue
6.6K
Sessions
4.5-5.0%
Conv. rate
$50-75
AOV
CLOSEST COMPETITORSby revenue
TOP MARKET PERFORMERSby revenue
bouncedolls.com vs top market performers
bouncedolls.com
top retailers
conversion rate vs average order value for bouncedolls.com and its competitors
Benchmark against your competitors for free
Continue with GoogleSign up with Google

Industries bouncedolls.com operates in

bouncedolls.com is tracked across 2 e-commerce industries. Explore market size, leading retailers and benchmarks for each.
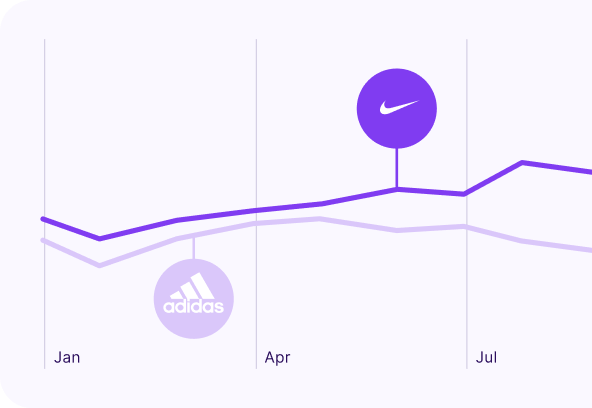
Review the entire assortment of this retailer and thousands of others in the Grips app
Sign in with GoogleSign up with Google
brands overtime comparison

Gain even more insights with the Grips app

bouncedolls.com channels

Identify top traffic channels that drive growth for bouncedolls.comand discover how performance of traffic channels has changed over time.

Sign in with GoogleSign up with Google

bouncedolls.com Google Ads spend

Evaluate bouncedolls.com's Google search ad spend, ad clicks and cost-per-click. Review performance over time and gain deeper view into their ad campaign spend.

Sign in with GoogleSign up with Google

bouncedolls.com devices

Review bouncedolls.com's performance across desktop and mobile devices. Analyze how revenue, conversion rate, transactions, AOV and sessions vary depending on the device shoppers use.

Sign in with GoogleSign up with Google

bouncedolls.com top markets

Explore bouncedolls.com's key markets, identifying countries that contribute the highest revenue, transactions, and sessions, along with those with the highest Google search ad spend.

Sign in with GoogleSign up with Google

bouncedolls.com country & global rank

Assess the ranking of bouncedolls.com among other retailers within its primary country and worldwide.

Sign in with GoogleSign up with Google
Understand how your competitors drive sales.
Drive growth and optimize key metrics with our e-commerce intelligence platform
Grips Platform Dashboard